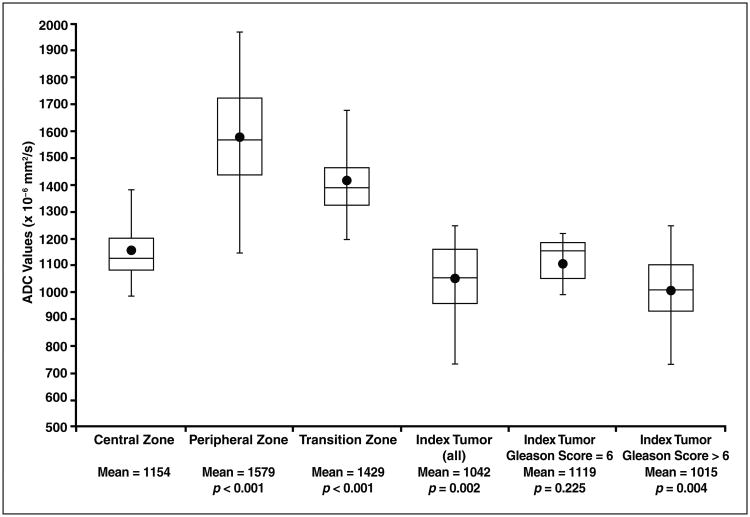
Fig. 2.
Box plots of apparent diffusion Coefficient (ADC) values. Statistically significant differences between ADC values of peripheral zone, transition zone, and index tumor categories versus ADC value of benign central zone (CZ) are shown, with p < 0.05 denoting statistical significance. Mean (circles), median (line in box), second and third quartiles (top and bottom of boxes), and maximum values (whiskers outside of boxes) are shown.

