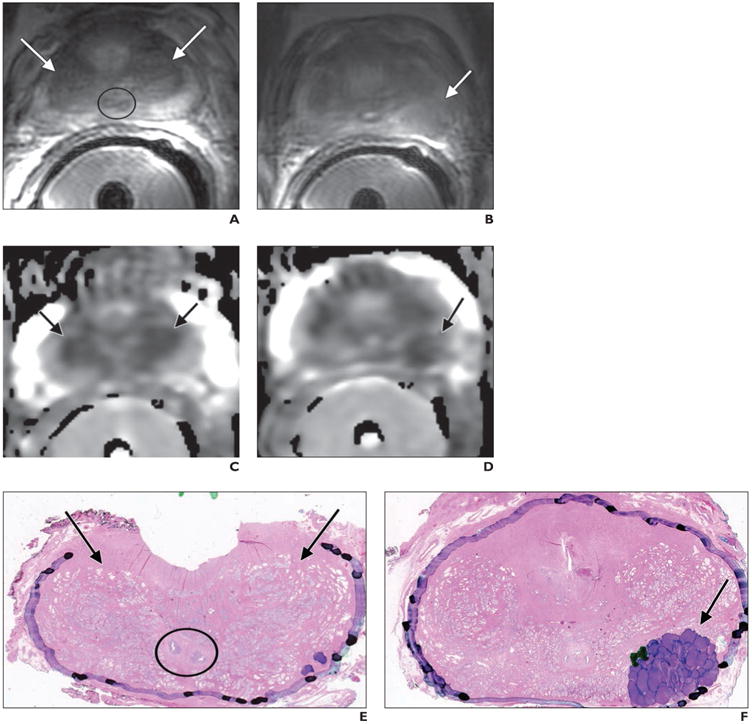
Fig. 3.

52-year-old man with prostate cancer and Gleason score of 4 + 3 at radical prostatectomy.
A, A xial T 2-weighted image shows normal appearance of the central zone (CZ) (arrows) at prostate base, situated between peripheral and transition zones and encircling ejaculatory ducts (circle).
B, Axial T2-weighted image shows histologically confirmed index tumor (arrow) located at left posterior prostate midgland.
C and D, Axial apparent diffusion Coefficient (ADC) maps show visually similar extent of decreased ADC (arrows) in both CZ (C) and index tumor (D). Measured ADC values were minimally lower in benign CZ (1036 × 10−6 mm2/s) than in index tumor (1072 × 10−6 mm2/s).
E and F, Whole-mount histopathologic slides (H and E stain, ×1.05) show benign CZ at base of prostate (arrows, E) and index tumor in left posterior midgland (arrow, F). Ejaculatory ducts (circle, E) are shown. Purple markings (F) denote that majority of tumor has components of Gleason pattern 4, with minority of components of Gleason pattern 3 denoted by dark green markings.
