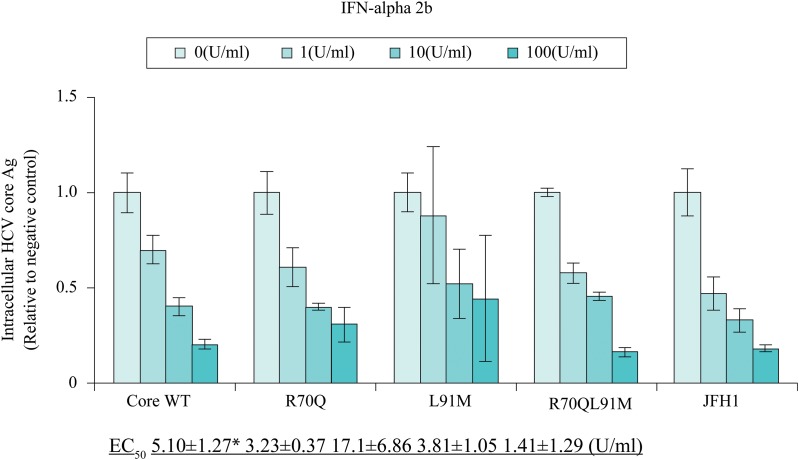
Fig. 4. Comparison of interferon (IFN) sensitivity between TPF1-M170T and JFH-1.
Expression of intracellular HCV core Ag was measured by chemical reaction immunoassay at 72 h post-transfection of Core wild type (WT), R70Q, L91M, R70QL91M, and JFH-1. Cells were treated for 48 h with 0–100 IU/mL. The values are displayed as percentages of the IFN-untreated control. *p < 0.05 compared with JFH1.

