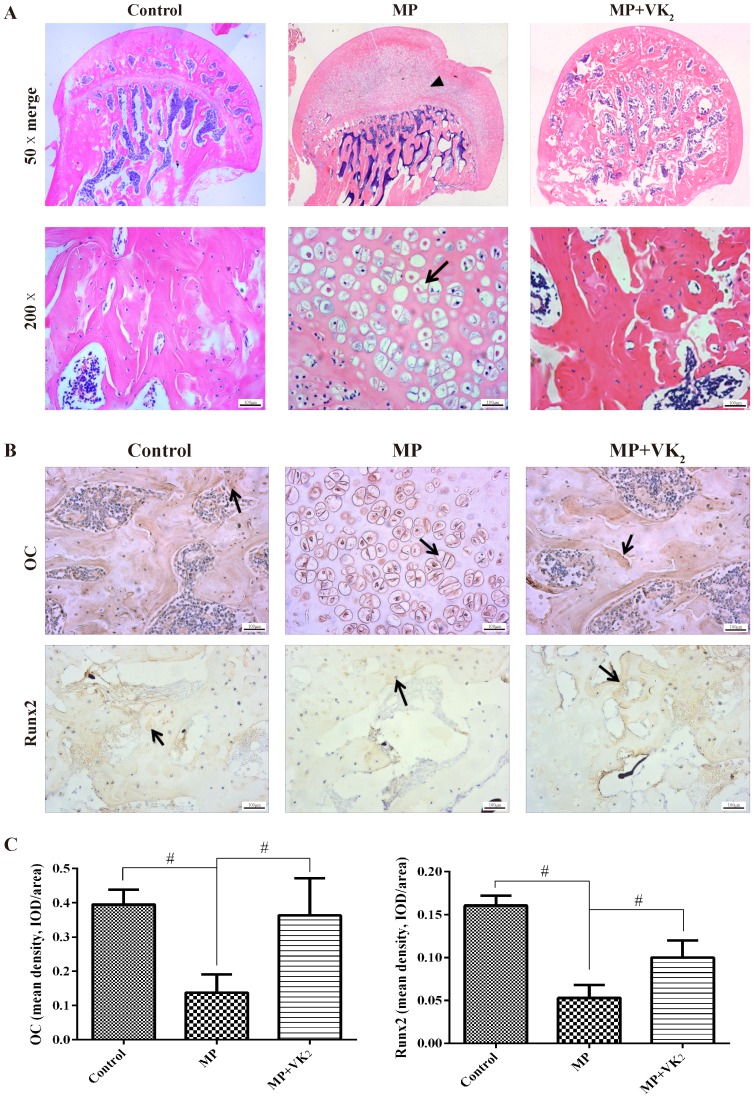
Figure 7.
Histological analysis of paraffin sections of the femoral heads. (A) HE staining of coronal sections of representative femoral heads in each group. The triangle indicates osteonecrosis, and the arrow indicates the empty lacunae and hypertrophic fat cells. (B,C) Immunohistochemical staining of Runx2 and OC of the coronal sections of representative femoral heads in each group; more positive brown staining was observed in the MP+VK2 group compared to the MP group. The arrow indicates the target protein staining (#, significant difference between the two groups, P<0.05).

