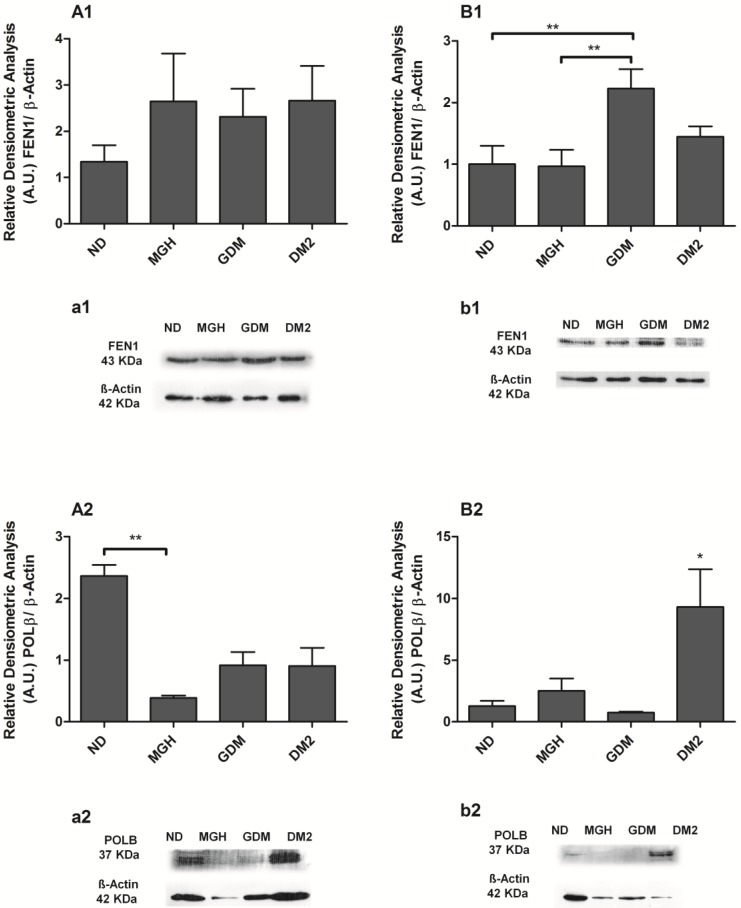
Figure 5.
Protein expression of FEN1 1 and POLβ 2 in PBMC isolated from maternal [A,a] and umbilical coord blood [B,b]. The relative band intensities from western blot experiments were normalized to β-actin and analyzed with Image J software [A1, A2, B1, B2]. Values as mean ± SEM; *p < 0.05 vs others groups; ** p < 0.05 vs appointed study group. n = 08/group.

