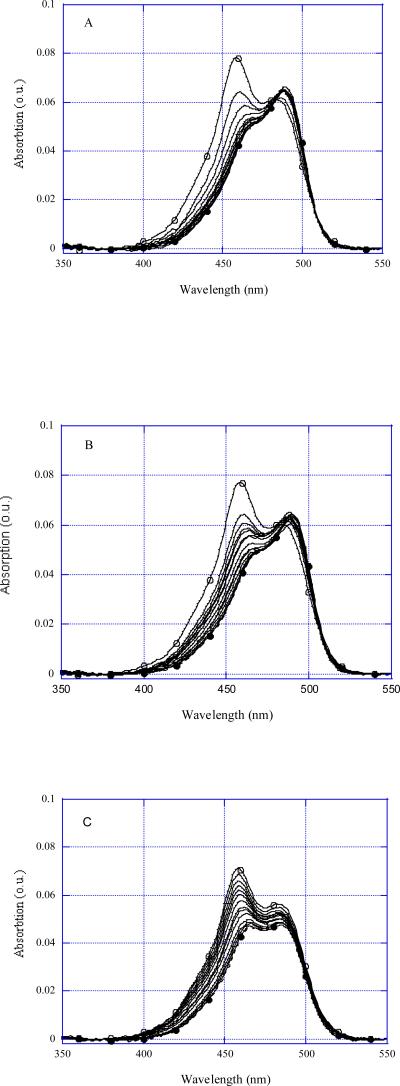
FIGURE 2.
YOYO absorption spectra at different additions of olighonucleotides. (A) R2APCW, (B) CW, (C) R2AP. Free YOYO concentrations were 10−6 M, R2APCW concentrations were from 1 to 20 μM; CW concentrations were from 1.5 to 41 μM, R2AP concentrations were from 0.5 to 82 μM. Solution dilutions were taken into account.

