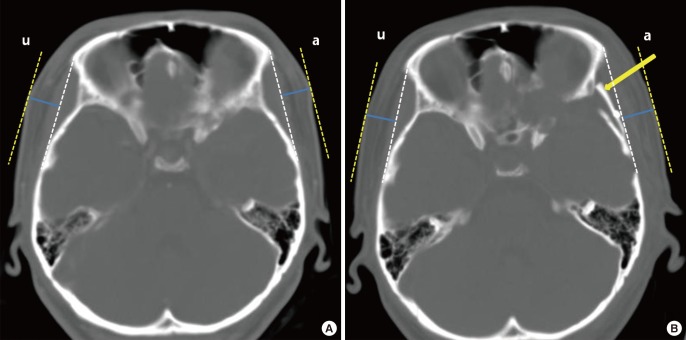
Fig. 1. Computed tomography (CT) images.
Temporal thickness was measured in postoperative CT images. Soft tissue thickness was measured perpendicularly (blue line) from the reference line extending from the lateral orbital rim to the tangential point on the temporal bone (white dotted line). Preoperative images are on the left, and six-month postoperative images are on the right. The axial images are from the end of the sphenoparietal suture level. (A, B) This patient underwent pterional craniotomy on the left side, with onlay graft reconstruction (yellow arrow). Postoperative temporal hollowness was not observed to a significant extent in the onlay graft group when a comparison was made between the non-operated (u) and operated sides (a).

