
Fig. 1.
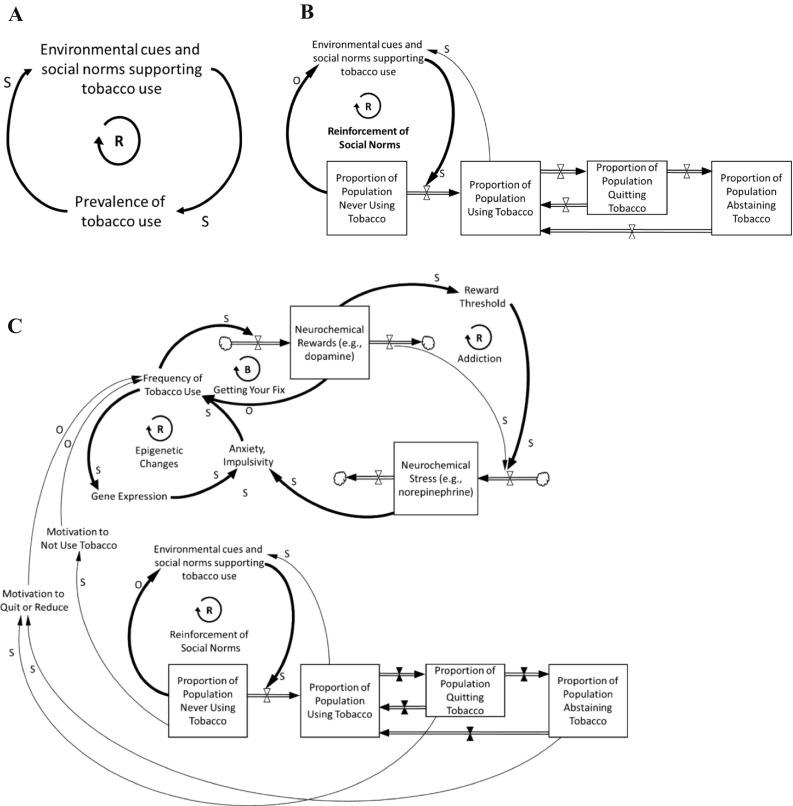
System dynamics diagram illustrating complexity in type 0 translation work supporting tobacco prevention, with increasing detail added across panels. Arrows indicate causal connections, where a change in the first variable triggers a change in the second over time, all else equal. S indicates variables move in the same direction, whereas O indicates movement in opposite directions. Boxes represent stocks, while double-lined arrows indicate flow between stocks over time. Feedback loops are indicated as either reinforcing R or balancing B. For a larger version of the figure, see Supplementary materials