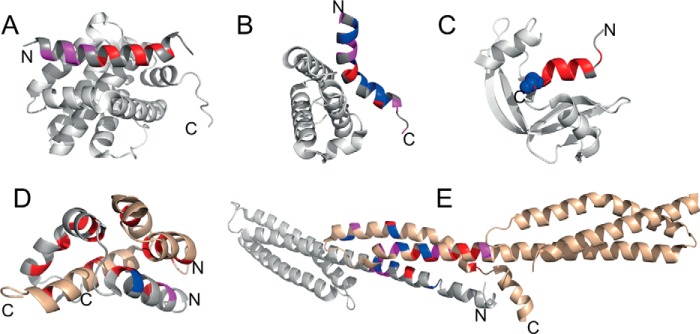
FIGURE 4.
Illustrations of coupled folding and binding reaction transition states. φ-Values are mapped onto structures of the following complexes: A, PUMA·Mcl-1 (PDB: 2ROC) (43); B, c-Myb·CBP KIX (PDB: 1SBO) (51); C, S-peptide·S-protein (PDB: 1FEV) (55); D, ACTR·NCBD (PDB: 1KBH) (56; E, α·β spectrin tetramerization domain (PDB: 3LBX) (44). In A, B, and C, the folded partners are shown in gray. In D and E, both partners are disordered; one is shown in gray, and one is shown in bronze. The residues in blue, magenta, and red represent high (φ > 0.6), medium (0.25 ≥ φ ≤0.6), and low (φ < 0.25) φ-values, respectively. N and C denote the N and C termini of the IDP (note that in E the disordered regions are capped by folded domains).

