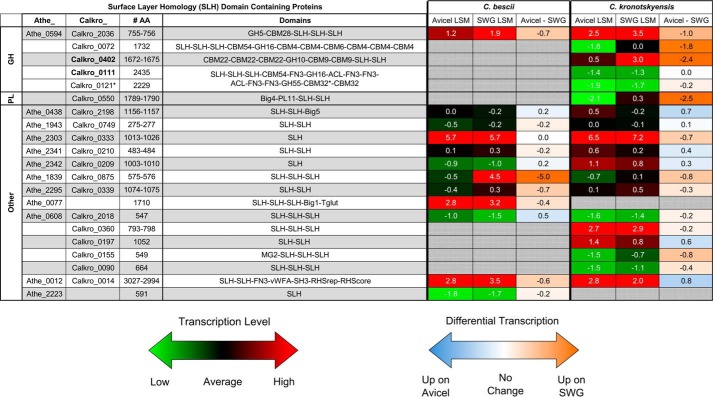
FIGURE 5.
Transcriptional response of genes encoding SLH domain proteins from C. bescii and C. kronotskyensis. Shown is the log squared mean (LSM) transcriptomic level of the 19 SLH domain proteins from C. kronotskyensis and 12 SLH domain proteins from C. bescii when each species is grown on crystalline cellulose (Avicel) and switchgrass (SWG). A log squared mean value of 0 represents average transcript abundance (black). Genes transcribed at levels higher than average have positive log squared mean values (red), whereas genes transcribed at levels lower than average have negative log squared mean values (green). Differential transcription is shown as Avicel minus switchgrass with negative values (orange) up-regulated on switchgrass relative to Avicel. Positive values (blue) are up-regulated on Avicel relative to switchgrass. Analysis is based on whole-genome oligonucleotide microarray experiments deposited in the NCBI Gene Expression Omnibus database with accession number GSE68810 (70). Big, bacterial immunoglobulin-like (CL0159); Tglut, transglutaminase-like superfamily (pfam01841); MG2, macroglobulin 2 (pfam01835); vWFA, von Willebrand factor type A (pfam00092); SH3, bacterial Src homology 3 (pfam08239); RHSrep, RHS repeat (pfam05593); RHScore, RHS-associated core domain (TIGR03696). *, Calkro_0121 is truncated after the first CBM32.

