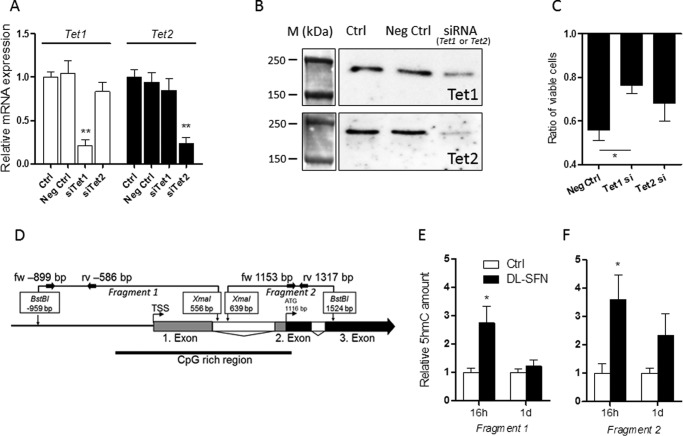
FIGURE 9.
Effects of SFN-induced active DNA demethylation in osteoblasts. Validation of mRNA (A) and protein (B) knockdown by specific siRNAs against Tet1 and Tet2 in MC3T3-E1 cells is shown. The effect of Tet1 and Tet2 knockdown on the cytostatic effect induced by dl-SFN in MC3T3-E1 cells is shown in C. In the schematic representation of the Atf4 proximal promoter/gene region, untranslated exons, translated exons, and introns are represented by gray, black, and white boxes, respectively. Analyzed fragments that overspan a CpG-rich region (bold black line) are shown. Small black arrows represent primer binding sites to quantify the selected fragments (D). Relative 5hmC amounts on Fragment 1 (E) and Fragment 2 (F) of the Atf4 proximal promoter/first exon in MC3T3-E1 cells after 16 h and 1 day of 3 μm dl-SFN treatment are shown. In A, E, and F, n = 3. In C, n = 4. A representative image is shown in B. M, protein marker. For RT-qPCR analysis, Tet1 and Tet2 gene expressions are referred to 18S rRNA expression. Cell proliferation in C is measured by cell count. In all bar charts, Ctrl is set to 1, and treatments are referred to as -fold change to Ctrl. Values are represented as the mean ± S.D.; error bars represent S.D. *, p ≤ 0.05; **, p ≤ 0.01. Neg, negative; fw, forward; rv, reverse; TSS, transcription start site.

