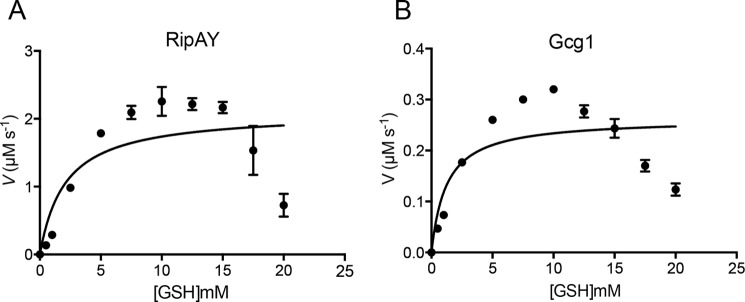
FIGURE 9.
Enzyme kinetic analysis of activated RipAY and Gcg1. Shown is a Michaelis-Menten plot of Trx-h5-activated RipAY (A) and Gcg1 (B) toward glutathione. Gcg1 (0.8 μm) or RipAY (0.04 μm) in the presence of Trx-h5 (8 μm) was used for determination of kinetic parameters. Different concentrations of glutathione were used ranging from 0.5 to 20 mm. Dug1-coupled assay was used for the study as described under “Experimental Procedures.” Data of three independent experiments were analyzed by non-linear regression using GraphPad prism version 6.0. Error bars, S.E.

