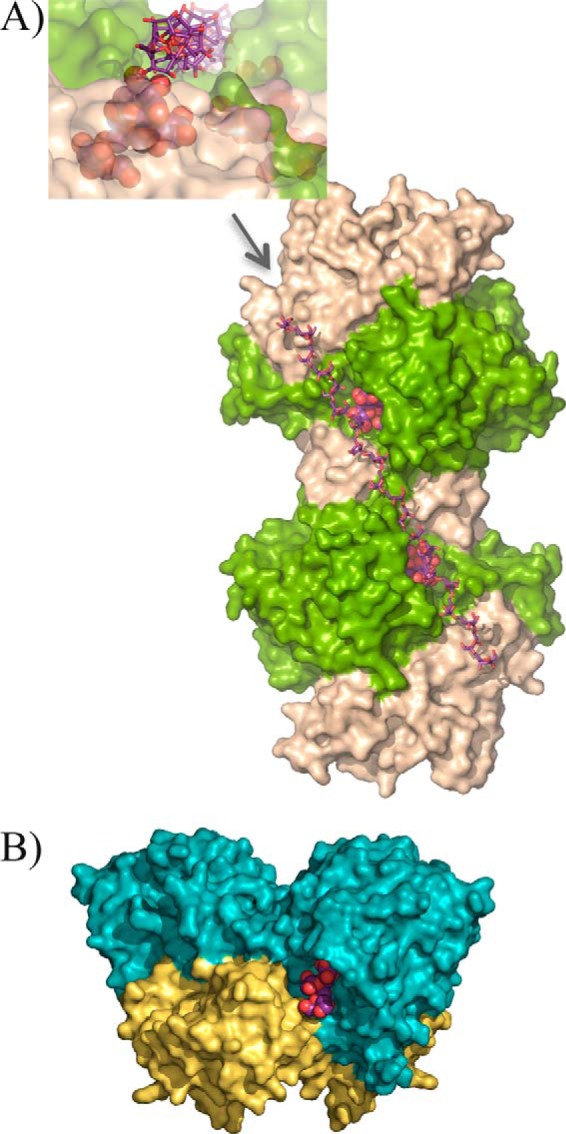
FIGURE 5.

XdINV versus SoFfase dimers. A, molecular surface of XdINV dimer showing the two catalytic domains in light green, and the corresponding β-sandwich domains are colored in sand. Each active site cavity is filled with a nystose molecule (in spheres) as found in the complexes obtained in this work and described below. A modeled β(2–6)-linked fructose chain (in sticks) has been manually docked into the long crevice that encompasses the two active sites and beyond. Inset, a detail of this crevice as viewed from the position indicated by the arrow, i.e. along the modeled levan-type fructose chain; a nystose molecule (spheres) is visible at one of the active sites. B, molecular surface of the SoFfase dimer showing the catalytic domains in cyan and their β-sandwich domains in yellow. Each active site is located at one face of the dimer, and only a fructosyl-nystose molecule found in the crystal (24) is visible as spheres.
