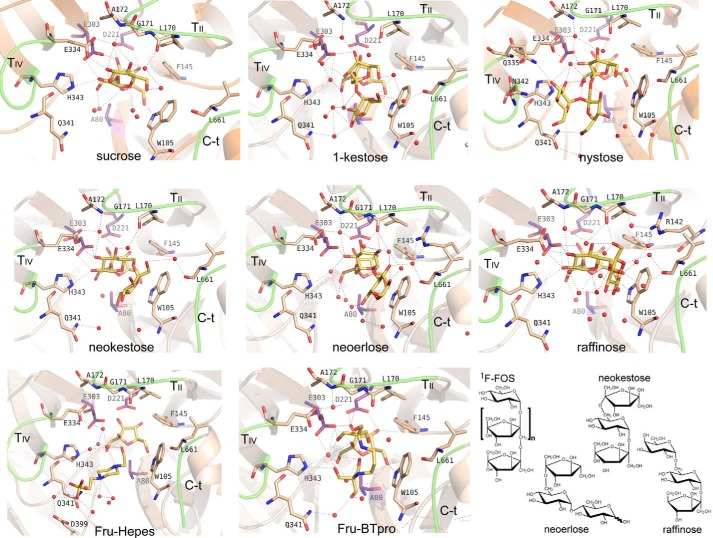
FIGURE 6.
Structure of the XdINV complexes. Close-up view of the active site showing the relevant residues making interactions with each ligand. Main polar interactions are represented as dashed lines. The interactions at subsite −1 are conserved and only shown in the XdINV-sucrose complex. The catalytic residues are highlighted in purple and the referred ligands in yellow. Chemical structure of the sugars is given in the scheme, the 1F-FOS is 1-kestose or nystose, when n = 1 or 2; sucrose, n = 0.

