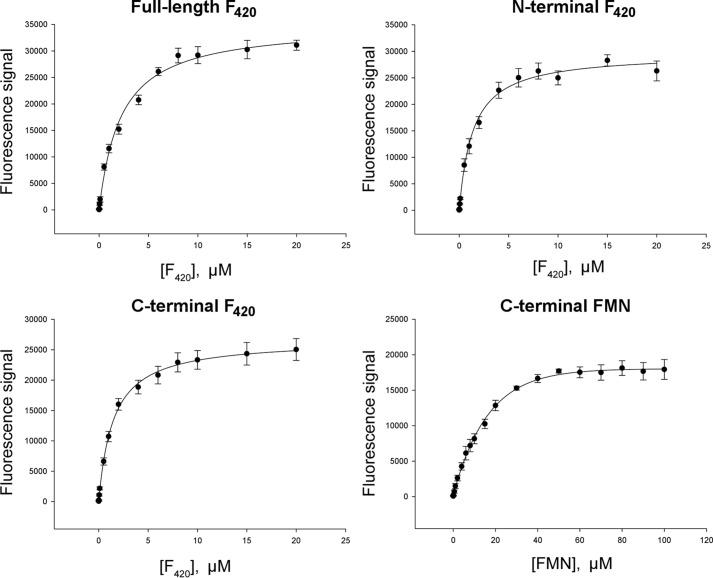
FIGURE 3.
Ligand binding by various FbiB constructs. The intrinsic fluorescence signal of F420 and FMN were used to monitor ligand binding and also to calculate dissociation constants (Kd) against the full-length protein and both of the individual domains, N- and C-terminal, as indicated. The F420 dissociation constants derived from these binding curves are Kd1 = 0.2 ± 0.4 μm and Kd2 = 3.0 ± 0.9 μm (full-length, two-site model), Kd = 1.4 ± 0.1 μm (N-terminal), and Kd = 1.47 ± 0.07 μm (C-terminal). FMN binding to the C-terminal domain of FbiB is also included, as labeled, and gives a dissociation constant of 14.7 ± 0.9 μm.

