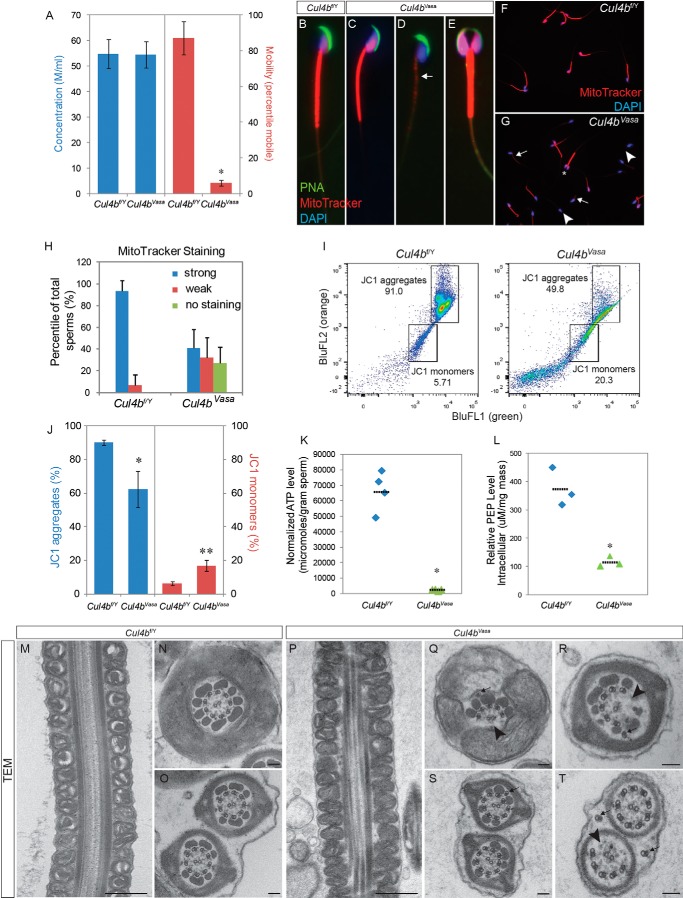
FIGURE 3.
Cul4bVasa mice are infertile because of abnormal sperm morphology and low motility. A, computer-assisted sperm analysis of epididymal spermatozoa revealed normal sperm number but extremely low sperm motility. B–G, morphology of epididymal sperms of control and Cul4bVasa mice stained for acrosome (peanut agglutinin (PNA), green), active mitochondria (MitoTracker, red), and nucleus (DAPI, blue). Weak or no mitochondrial staining was noted in a large fraction of mutant sperms (arrow in D, compared with control in B or a relatively normal mutant sperm in C). E, in addition, 6.6 ± 3.4% mutant sperms showed double heads but joined by a fused flagellum. F and G, representative low magnification images of sperm smear stained with DAPI and MitoTracker. Arrows, weak MitoTracker staining; arrowheads, no MitoTracker staining; asterisk, double-headed sperm. H, quantification of MitoTracker staining. In controls, 93.4 ± 9.8% (n = 8) sperm showed strong staining. In contrast, 32.2 ± 18.1% and 27.0 ± 15.0% (n = 9) of mutant sperm showed either weak or no staining, respectively. I, representative FACS results of JC1-stained spermatozoa showing reduced JC1 aggregate population and increased JC1 monomer population in the mutant (right panel) than control (left panel). J, quantification of JC1 FACS showing significant changes in distribution of the two populations: JC1 aggregates (Cul4bf/Y, 90.2 ± 6.2%, n = 5; Cul4bVasa, 62.3 ± 10.8%, n = 3, p = 0.045) and JC1 monomers (Cul4bf/Y, 6.2 ± 1.1%, n = 5; Cul4bVasa, 16.8 ± 3.3%, n = 3 p = 0.024). K, markedly reduced ATP level in the mutant sperms. L, spermatozoa PEP levels were significantly reduced in the mutant sperms. *, p = 0.017. M–T, transmission electron microscopy revealed abnormal ultrastructure of Cul4bVasa spermatozoa. Mitochondrial sheath around midpiece appeared morphologically normal in Cul4bVasa (P) compared with that of the controls (M). Q and R, a spectrum of axoneme defects, including missing microtubule doublets and associated outer dense fibers (arrowheads), displaced (arrows in Q and T), and extra microtubule doublets (arrow in S). Typical morphology of cross-sections of at the principle piece and end piece were shown in N and O, respectively. Scale bars, 500 nm in M and P, 100 nm in the rest TEM images.

