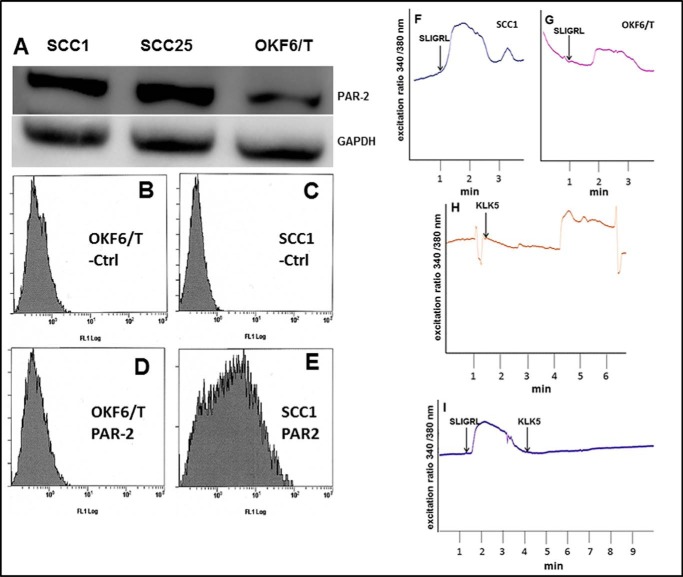
FIGURE 2.
PAR-2 expression and activation in OSCC cell lines. A, Western blot showing elevated PAR-2 protein in SCC1 and SCC25 cell lines relative to immortalized oral keratinocyte line OKF6/T. Cell lysates were electrophoresed on 9% SDS-polyacrylamide gels and electroblotted to Immobilon. Upper panel, blots were probed with murine anti-PAR-2 antibody (1:100 dilution) followed by an HRP-conjugated secondary antibody (1:4000 dilution). Loading controls (lower panel) were probed with mouse anti-GAPDH (1:500) and an HRP-conjugated secondary antibody (1:10,000). The experiment was repeated in triplicate, and a representative blot is shown. B–E, flow cytometry analysis of cell surface PAR-2. B and D, OKF6/T; C and E, SCC1 cell lines were incubated on ice with vehicle (B and C) or anti-PAR-2 antibody (1:100) (D and E) followed by FITC-conjugated secondary antibody (1:500) and evaluated using a Beckman/Coulter FC500 cell sorter. F–I, analysis of PAR-2 activation-induced calcium signaling. Cell lines were loaded with Fura2AM and incubated with the PAR-2 agonist peptide SLIGRL-NH2 (50 μm) or KLK5 (3.23 μm), as indicated. Shown in each trace is a representative single cell Ca2+ response measured as 340/380 fluorescence intensity (F.I.) ratio. The calcium response is the difference in the peak value and baseline value. F, peptide (SLIGRL-NH2, 50 μm) activation of PAR-2 in SCC1 cell line. G, peptide (SLIGRL-NH2, 50 μm) activation of PAR-2 in OKF6/T cell line. H, KLK5 (3.23 μm) activation of PAR-2 in SCC1 cell line. I, de-sensitization experiment showing lack of additional calcium response in SCC1 cells treated with SLIGRL-NH2 (50 μm) followed by KLK5 (3.23 μm).

