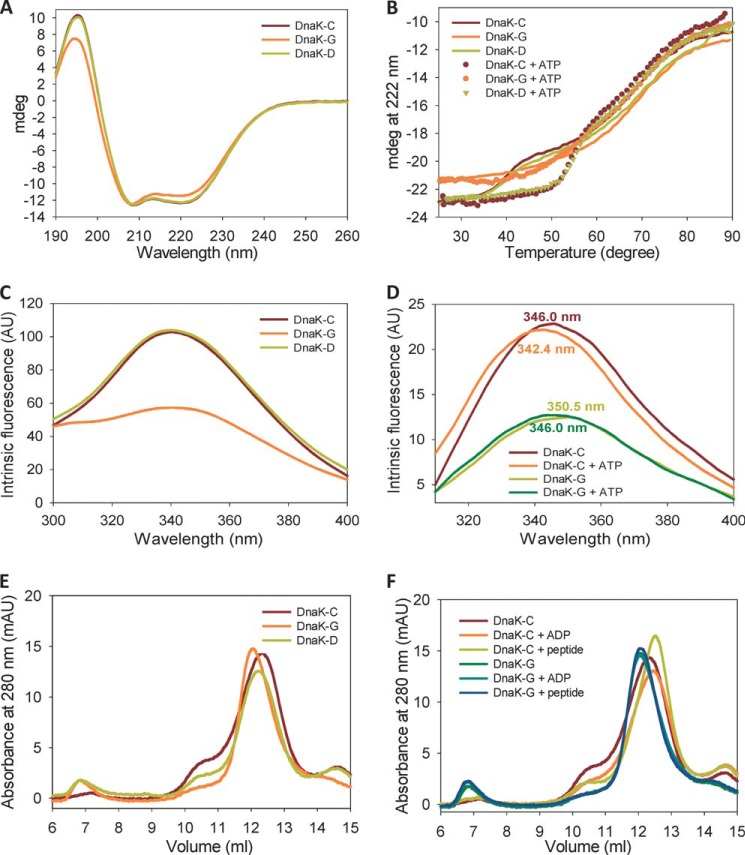
FIGURE 4.
Effect of glutathionylation on structure and allosteric conformational changes of DnaK. Data are shown for untreated control (DnaK-C), glutathionylated (DnaK-G), and deglutathionylated (DnaK-D) samples of DnaK with or without peptide or nucleotides as indicated. Samples were in Buffer B. AU, arbitrary units; mAU, arbitrary units/1000; mdeg, millidegrees. A, secondary structure differences were monitored by acquiring far-UV CD spectra for 14 μm DnaK in a 0.1-mm cuvette. B, thermal denaturation was monitored by the CD signal at 222 nm for 2.5 μm DnaK in a 1-mm cuvette. C, intrinsic fluorescence spectra of 2 μm DnaK were measured using an excitation wavelength of 280 nm. D, conformational change of DnaK induced by ATP was monitored by comparing differences in the intrinsic fluorescence spectra of 2 μm DnaK in the absence and presence of ATP using an excitation wavelength of 295 nm. E, the oligomeric state of DnaK was determined by SEC. F, conformational change of DnaK induced by nucleotide or peptide was monitored by comparing differences in the elution peak using SEC.

