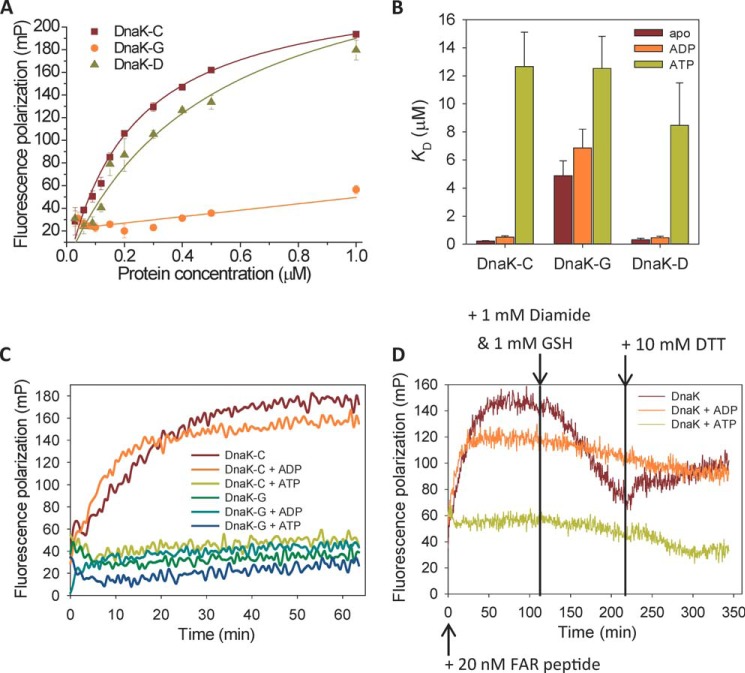
FIGURE 6.
Effect of glutathionylation on peptide binding to DnaK. Data are shown for untreated control (DnaK-C), glutathionylated (DnaK-G), and deglutathionylated (DnaK-D) samples of DnaK with or without nucleotides as indicated. Experiments were performed in Buffer B. A, fluorescence polarization at 520 nm after excitation at 485 nm was used to monitor the binding of 20 nm FITC-labeled ALLLSAPRR peptide to different concentrations of DnaK in the absence of nucleotide with or without glutathionylation as indicated. The data shown are the mean of three independent experiments, and the error bars represent the S.E. B, the affinity constants (KD) for binding of DnaK to ALLLSAPRR peptide in apo, ADP, and ATP states as indicated were calculated by fitting the binding curve (see “Experimental Procedures”) measured by fluorescence polarization for different concentrations of DnaK with or without glutathionylation as indicated. The data points in each binding curve were the mean of three independent experiments, and the error bars shown represent the S.E. of the fit. C, kinetics of 20 nm peptide binding to 1 μm DnaK before or after glutathionylation in apo, ADP, or ATP states as indicated. D, effect on kinetics of peptide binding to DnaK of glutathionylation (1 mm GSH and 1 mm diamide) and deglutathionylation (10 mm DTT) conditions introduced at the time points indicated. Fluorescence polarization at 520 nm after excitation at 485 nm was used to monitor the binding of 20 nm ALLLSAPRR peptide to 1 μm DnaK in apo, ADP, and ATP states as indicated. FAR, FITC-ALLLSAPRR peptide; mP, millipolarization units.

