
FIGURE 4.
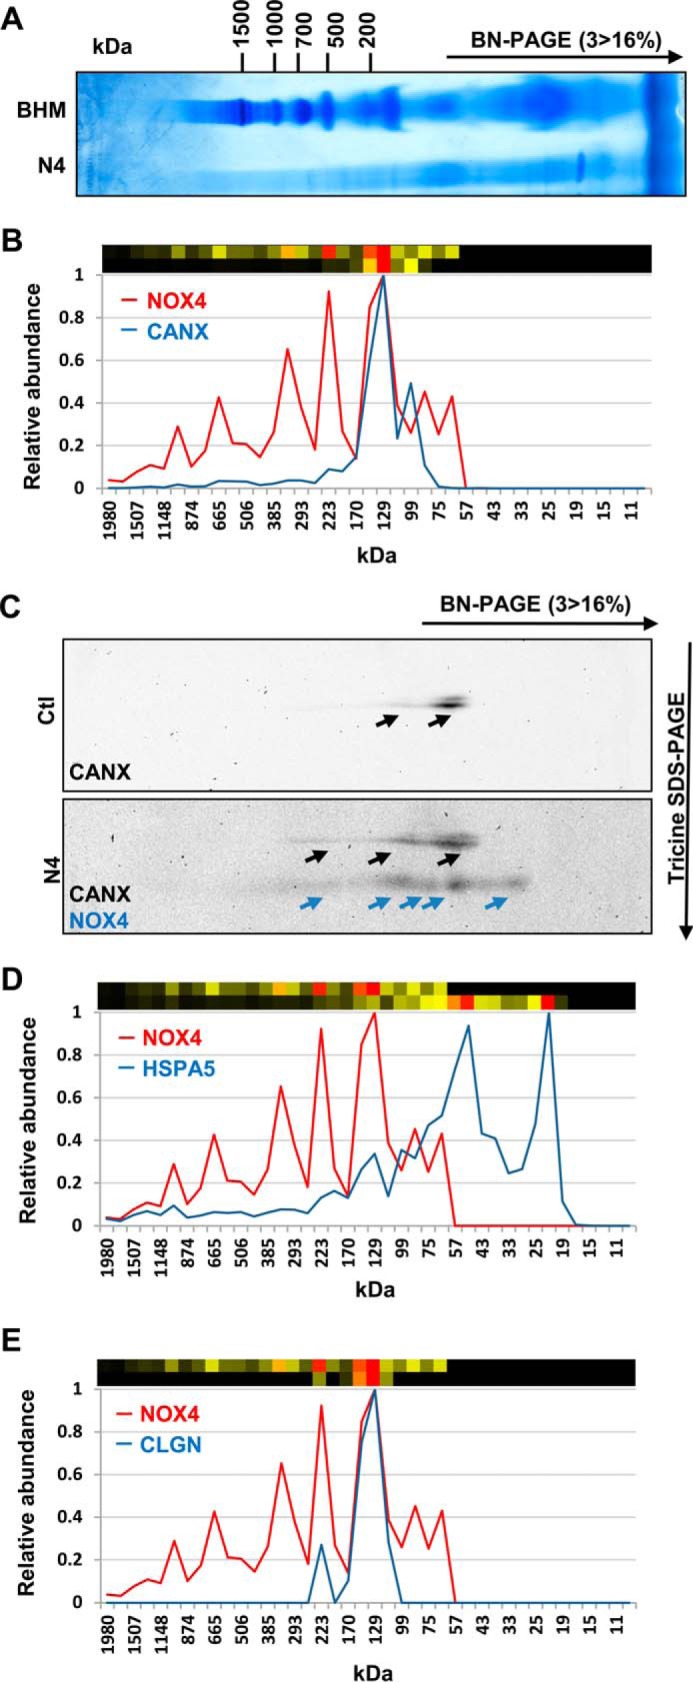
Migration profiles of NOX4 and Calnexin, HSPA5, or calmegin, identified by complexome profiling and two-dimensional BN/SDS-PAGE. One-dimensional BN-PAGE of NOX4 15,000 × g membrane pellets (6 g of digitonin/g of protein) (A) was analyzed by MS-based Complexome profiling (B, D, and E). Relative abundance of MS identified NOX4 (red) and CANX (B) HSPA5 (D) and calmegin (CLGN) (E) (blue) are plotted against the apparent molecular mass separated by one-dimensional BN-PAGE. Corresponding heat maps are shown above (upper, NOX4; lower, CANX, HSPA5, and CLGN). Red indicates the highest intensity and black the lowest intensity. C, representative two-dimensional BN/SDS-PAGE Western blot of membrane preparation of Ctl and NOX4-HEK293 cells and immunoblotting with CANX and NOX4 as indicated.