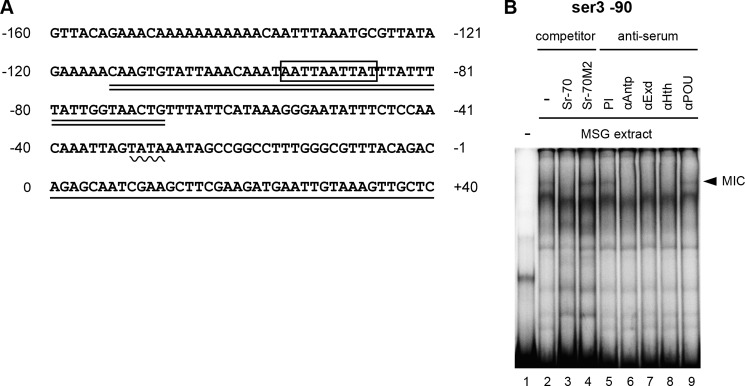
FIGURE 2.
A, sequence of the putative promoter region for ser3. The boxed region indicates the hypothetical MIC binding site, the wavy line indicates the putative TATA box, the underlined sequence indicates the transcribed region, and the double underlined sequence indicates the oligonucleotide utilized for the EMSA analysis (ser3 −90). B, binding of MIC to the ser3 promoter. The band representing the presumptive MIC binding is indicated with the arrowhead. The addition of the non-labeled Sr-70 oligonucleotide (lane 3) abolished the binding, whereas Sr-70M2 did not (lane 4). Antiserum against Antp (lane 6), Extradenticle (Exd) (lane 7), and Homothorax (Hth) (lane 8) also interfered with binding, but the preimmune serum (lane 5) or antiserum against POU-M1 (lane 9) did not show an effect.

