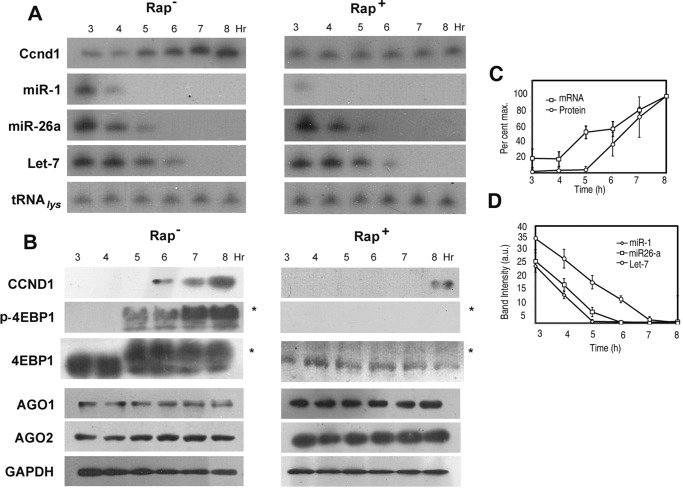
FIGURE 1.
Expression of Ccnd1 and miRNAs during serum stimulation. Serum-starved L6 myoblasts were stimulated with serum for indicated times. A, Northern, and B, Western blots probed with antisense oligonucleotide (A) or antibody (B), respectively, against the indicated RNA (1 × 10⁵ cell-equivalent) or protein (4 × 10⁴ cell-equivalent). *, phospho-form of 4EBP1, migrating slower than the dephospho-form. C, quantified band intensities of Ccnd1 mRNA and protein between 3 and 8 h of serum stimulation, represented as percent of the maximum value. D, parallel down-regulation of miR-1, miR-26a, and Let-7 in serum-stimulated cells. Northern blot band intensities (arbitrary units) were quantified by densitometry.

