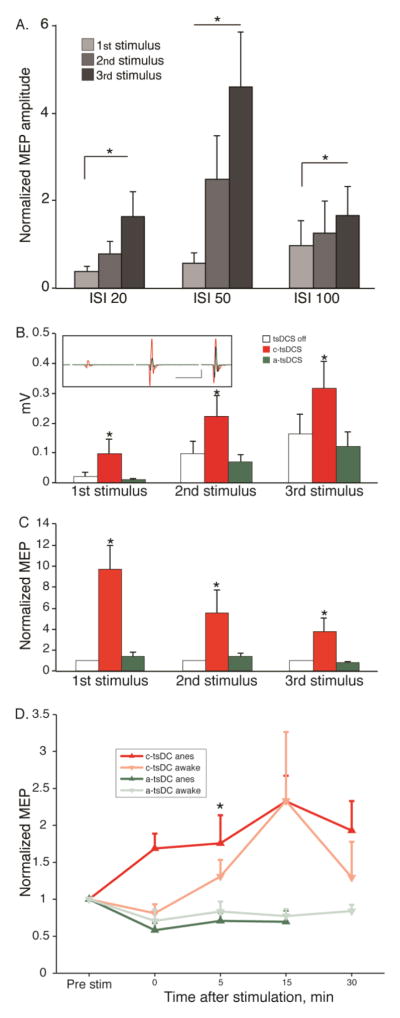
Figure 3.
MEP facilitation and effect of tsDCS on MEP facilitation. A. Effect of 3-pulse electrical stimulation of M1 on EMG output (Protocol 1). Average MEP response ± SE to the first, second, and third of the 3 stimuli within the burst at different ISIs. Data are normalized to the response to a 3 ms ISI. The response evoked by the 50ms ISI was significantly larger (measured as the peak-to-peak) than other ISIs (12 sessions from 6 rats; *p<0.05, signrank; error bar: mean + S.E). B. Polarity-dependent effect of tsDCS on the average (+S.E) peak to peak amplitude of evoked MEP (Protocol 2). (*p<0.05, signrank) Inset shows a representative average of the MEP amplitude/waveform without tsDCS (black), with anodal tsDCS (green), and c-tsDCS (red). C. To eliminate the contribution of facilitation due to the multipulse M1 stimulation, each average MEP amplitude was divided by the response without tsDCS. (Data in A and B are from 12 sessions from 6 rats; *p<0.05, signrank; error bar: mean + S.E). D. Aftereffect of c-tsDCS and a-tsDCS. Data are presented for anesthetized (darker lines) and awake animals (lighter lines). (anesthetized: n=9 sessions in 6 rats; awake: n= 6 sessions in 2 rats; signrank, * p<0.05).

