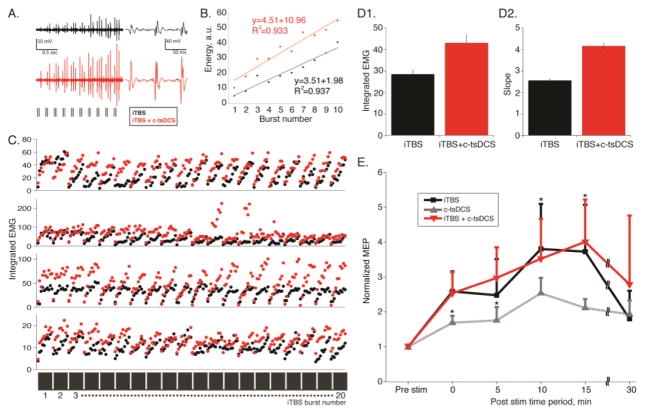
Figure 4.
Facilitation of iTBS is augmented by c-tsDCS (Protocol 2). In this figure black traces, plot lines, and data points are for iTBS only and red, iTBS+c-tsDCS. A. Average of each stimulus presentation during the 2 second iTBS stimulation period (left), aligned with the onset of stimulation. The vertical tic marks below the averages on the left correspond to the triple-pulse stimuli (ISI 50 ms) evoking each set of MEPs. These averages show the changes that occur in MEP amplitude during the 2 second duration of the burst, for the entire period of stimulation (192 sec). The traces to the right are single averages of the 3-pulse stimulation for the entire 192 sec period. B. Scatter plot of MEP integrated rectified EMG response evoked by the 3 stimuli for each burst. We summed the measurements for each stimulus to obtain a combined index of EMG for each triple-pulse stimulus. This graph quantifies the changes in MEP amplitude during the 2 second stimulation period. Linear regression data are indicated in the figure (iTBS only, p<0.001; iTBS+c-tsDCS; p<0.001). C. Amplitude of MEPs to each triple-pulse stimulus during the 192 seconds of iTBS for 4 different rats. The dark gray bars (bottom of part C) represent each 2 second burst (i.e., as in A) and the gaps represent the 8 second interval without stimulation. D. Bar graphs showing changes in MEP rectified and integrated MEP (D1) and the change in slope of linear fit for each 2 second stimulus period shown in part C (D2) (ttest; *p<0.05, ttest). E. Aftereffects of iTBS and modulation by cathodal tsDC under anesthetized condition. Mean change (+S.E) in MEP peak-to-peak amplitude during the 30 minute period following a single epoch of iTBS. Values are relative to MEP amplitude during the pre-stimulation period. (iTBS: n=5 sessions in 4 rats; c-tsDC: n= 9 sessions in 6 rat; iTBS+c-tsDC: n=3 sessions in 3 rats; * p<0.05; signrank).

