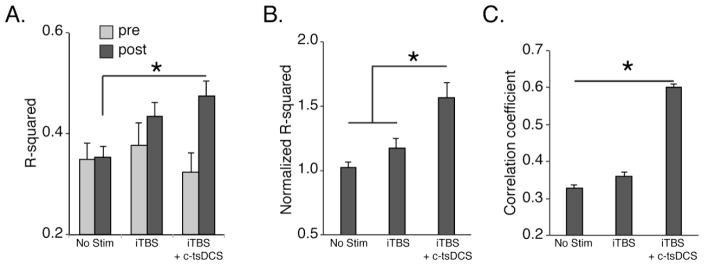
Figure 5.
Regression of local field potential (LFP) in M1 to EMG in ECR muscle during overground locomotion (Protocol 3). A. Effect of iTBS alone and in combination with c-tsDCS on the computed R-squared value of the regression between LFP and EMG. B. R-squared values normalized to the no stimulation condition. C. Correlation between MEP amplitude and R-squared value for each testing day. The correlation coefficient between MEP and R-squared value changes was significantly different among different conditions (bootstrapping, n=1000 times). (*p<0.05, signrank).

