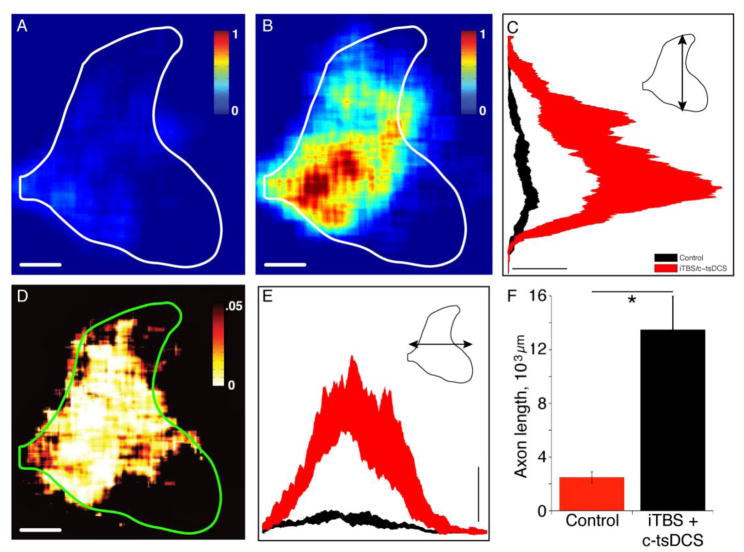
Figure 8.
Ipsilateral CST axon terminal ourgrowth (Protocol 4). A, B. Regional axon density maps plotted using the same color scales from the group mean data for injury only (A) and injury + stimulation (B) show that the combined stimulation promoted axonal outgrowth. Outgrowth was not uniformaly distributed within the ipsilateral gray matter. Calibration: 500 μm. Color scale bars are in arbitrary units and are the same for A and B. C, E. The dorsoventral (C) and mediolateral (E) projections of the 2-D heatmaps. Band represents ± 95% confidence interval. Calibration: 1×10−’4mm axon/pixel. D. Significance map, based on t-statistic values for each pixel. Calibration: 500 μm. F. Total axon length was significantly higher (5.4-fold) in the stimulated group than the non-stimulated control group. Error bars and line are mean ± S.E (n=6 for stimulated; n=6 for control). (*p<0.05, ttest).

