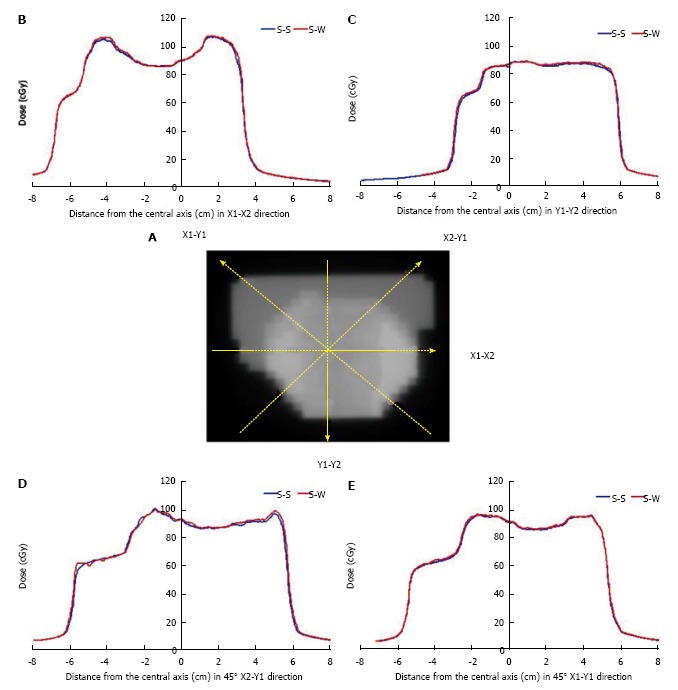
Figure 16.

Fluence map of an anterior-posterior beam segment. A: Fluence map for an anterior-posterior segmental beam for the prostate IMRT; B-F: The broken lines represent the beam profiles measured at the X1-X2 (B), Y1-Y2 (C), 45° X2-Y1 (D) and 45° X1-Y1 (E) direction. The blue curve is the profile using the step-and-shoot algorithm (S-S), while the red curve is the profile using the sliding window (S-W) algorithm from Pinnacle3 and SWIMRT respectively.
