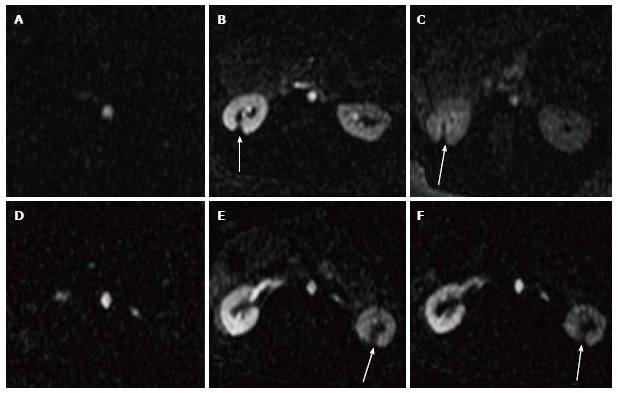
Figure 3.

Selected 2D perfusion magnetic resonance images acquired from two representative animals. The images show the arrival of Gd-DTPA bolus (A, D) in the aorta and 20-120 s (B, E and C, F) in the kidneys. Arrows denote the hypoperfused ablated lesions.
