
FIG 6 .
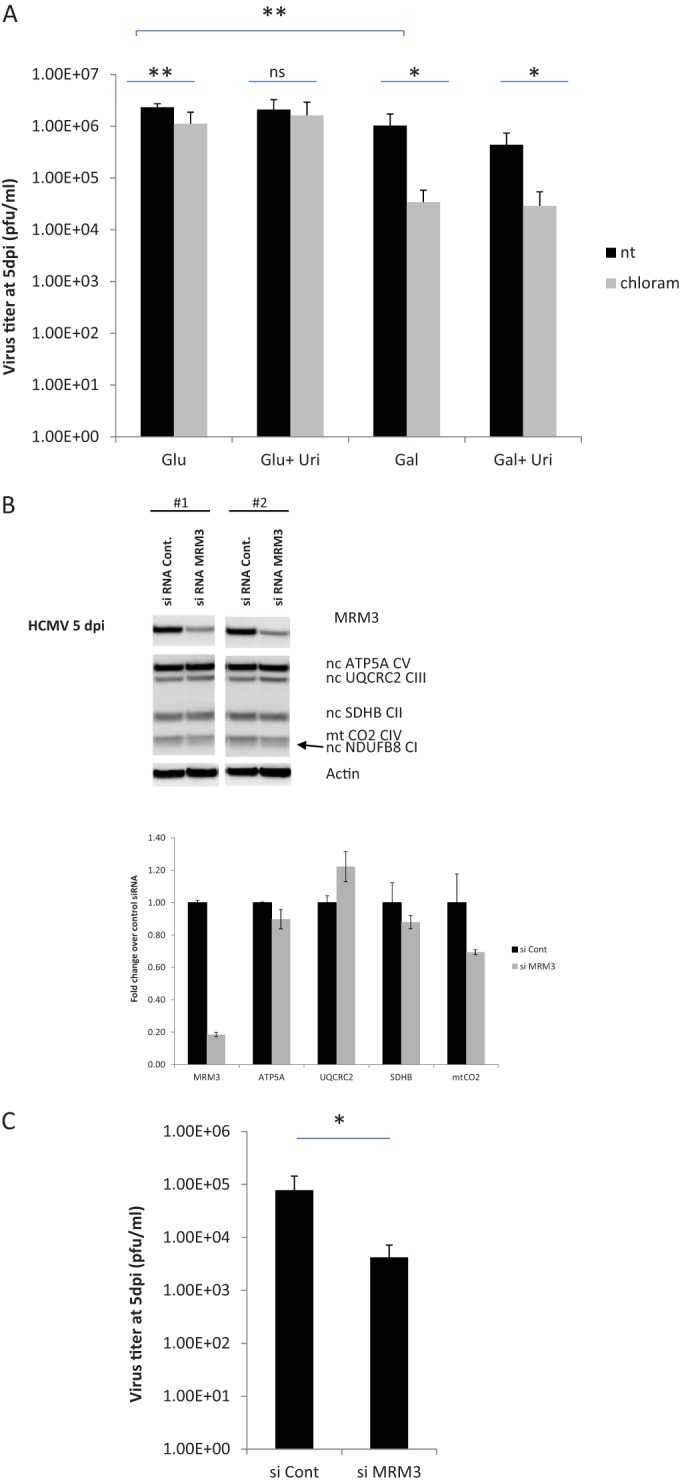
Inhibition of mitochondrial translation reduces virus titers. (A) HFFF2 cells were infected with HCMV at an MOI of 5 for 1 h and then washed and refreshed with DMEM supplemented with 10% dialyzed FBS, 2 mM glutamine, and antibiotics (DMEM-10dFBS) and 5 mM glucose. At 24 hpi, cells were washed and refreshed with DMEM-10dFBS containing either 5 mM glucose or 5 mM galactose with or without the addition of 0.2 mM uridine. Each medium was either left nontreated (nt) or was treated with chloramphenicol (50 µg/ml) to block mitochondrial translation. At 5 dpi, media were collected from cells, and released virus titers in supernatants were quantified using the 50% tissue culture infective dose (TCID50). Error bars represent the standard error of the mean (SEM) from two experiments with three replications each. (B and C) HFFF2 cells were transfected with a control siRNA or an siRNA targeting MRM3. After 22 h of transfection, cells were infected with HCMV (Merlin) at an MOI of 3, and at 24 hpi, cells were washed and refreshed with DMEM-10dFBS containing 5 mM galactose. At 5 dpi, media were collected from infected cells, and virus titers were quantified using the TCID50 (C). Cells were lysed and analyzed by WB; the results of two biological repeats are shown (B). The chart shows the fold change in protein abundance compared to control siRNA-treated cells. Error bars in panel C represent the standard errors from two biological repeats, each performed with three transfection replicates. *, P < 0.05; **, P < 0.001 (unpaired t test with Welch’s correction).