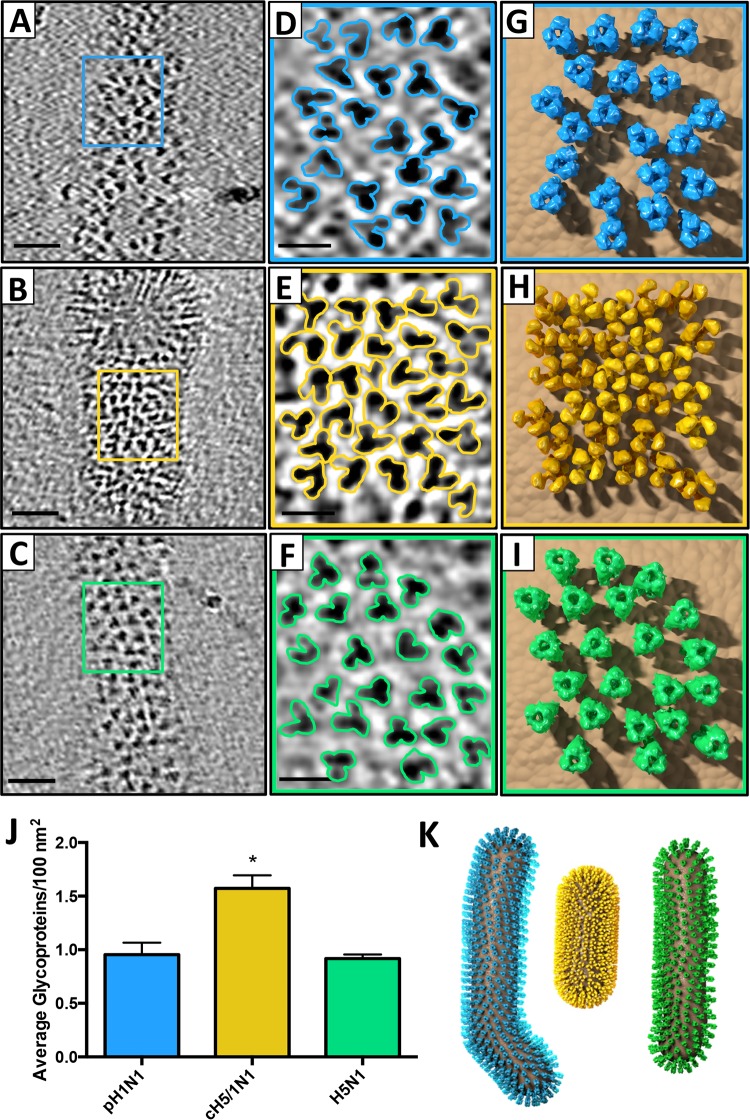
FIG 3 .
cH5/1 HA density on the viral surface is significantly greater than that of H1 or H5 HA. (A to C) HA trimers on the viral surface are shown in tomographic slices of pH1N1 (A), cH5/1N1 (B), and H5N1 (C). (D to F) Enlarged views of the boxed regions in panels A to C are shown in panels D to F with trimeric HA proteins outlined. (G to I) Models corresponding to the viral surface areas shown in panels D to F of pH1N1 (G), cH5/1N1 (H) and H5N1 (I) are shown with the respective HA density maps obtained by subvolume averaging. (J) HA trimer density per 100 nm2 plus standard error of the mean (SEM) of viral surface area is plotted for each influenza strain. The value that is statistically significantly different (P = 0.002) from the other values as determined by one-way ANOVA is indicated by an asterisk. (K) 3D virus models for pH1N1 (cyan), cH5/1N1 (gold), and H5N1 (green) were created based on spike density measurements.

