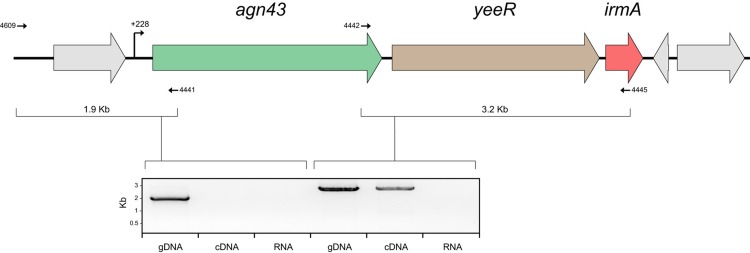
FIG 3 .
Structural organization of the agn43-yeeR-irmA operon. A PCR amplification product was obtained using primers overlapping the agn43-yeeR-irmA genes and flanking regions. Primers are represented by arrows, and the expected amplicon size is indicated. The amplified product from EC958 genomic DNA (gDNA; positive control), EC958oxyR cDNA, and EC958oxyR RNA (RNA; negative control) is shown.

