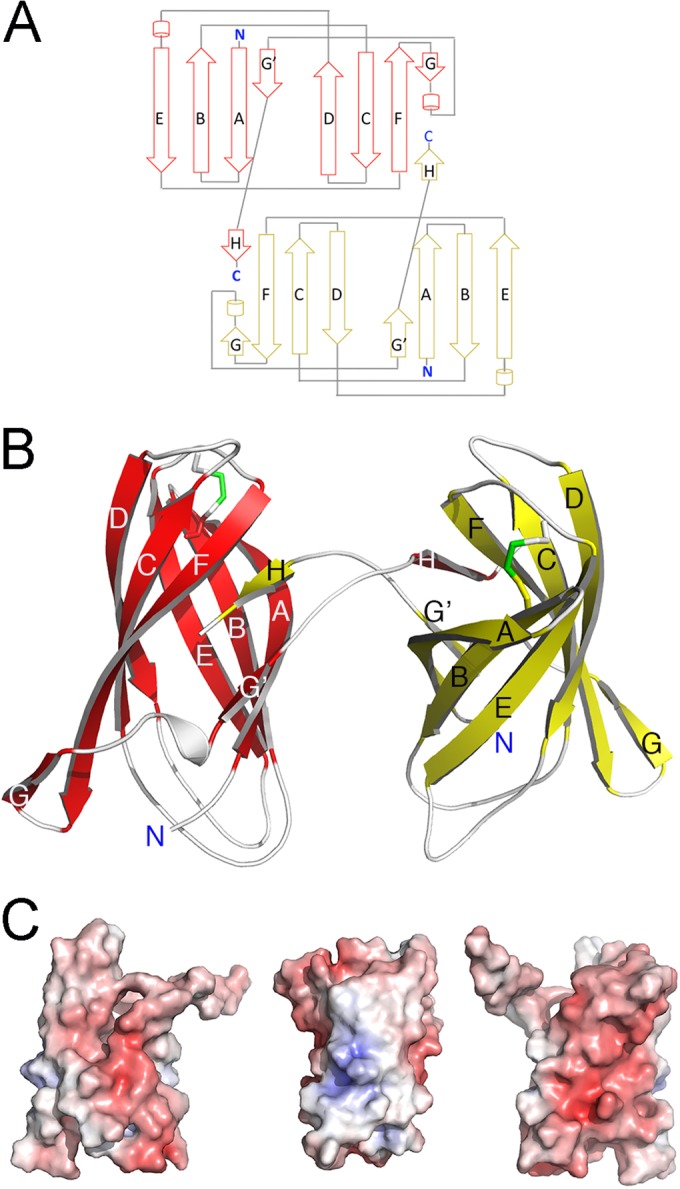
FIG 4 .

Crystal structure of IrmA. (A) Topology diagram of the IrmA dimer. The monomer conformations are shown in red (top) and yellow (bottom). (B) Ribbon representation of IrmA domain-swapped dimer with the protomers of the dimer shown in red and yellow (β-strands are indicated as arrows and are labeled). (C) Electrostatic surface of the IrmA monomer. Positive and negative electrostatic potentials are shown in blue and red, respectively (saturation at 10 kT/e). The orientation of the left panel corresponds to that in the lower panel in Fig. 4A. The orientations in the middle and left panels correspond to the protein rotated by 90° and 180° along the axis of the FNIII domain (y axis).
