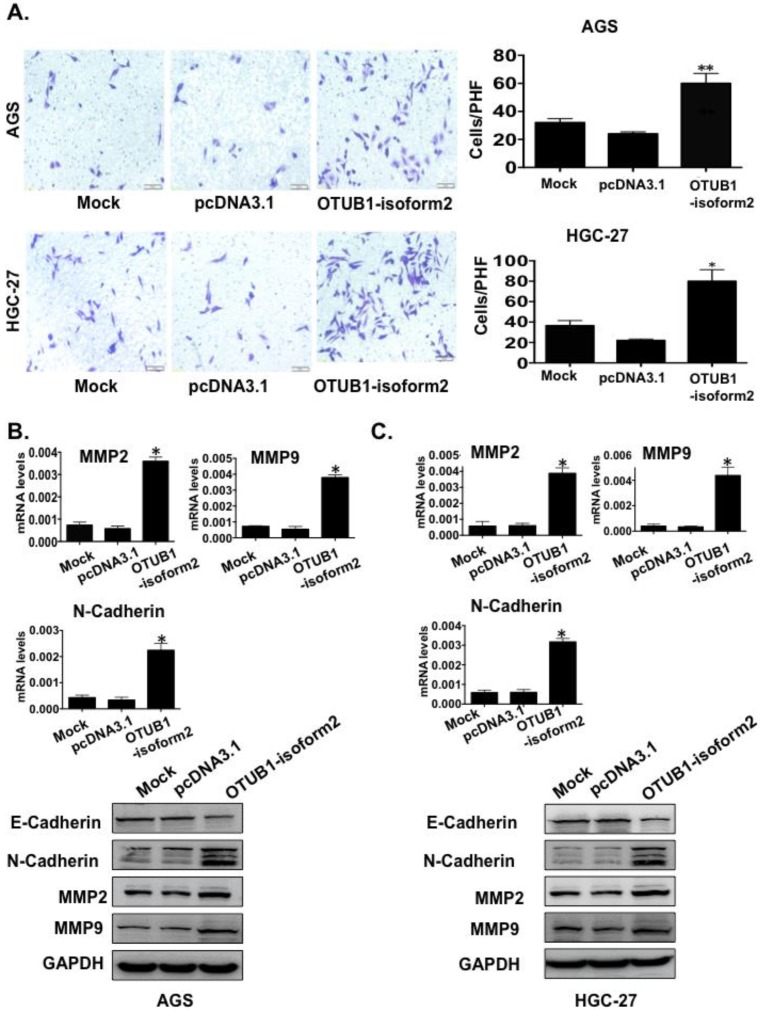
Figure 7.
OTUB1-isoform 2 induced tumor cell invasion in GC. A. Representative images (left) and quantification (right) of transwell invasion assays for the indicated cells. (Scale bars, 50 µm). *: p<0.01. **: p<0.05. B. RT-qPCR and immunoblotting E-cadherin, N-cadherin, MMP2 and MMP9 results in AGS cells. GAPDH was used as the reference control. *: p<0.01. C. RT-qPCR and immunoblotting results of E-cadherin, N-cadherin, MMP2 and MMP9 results in HGC-27 cells. GAPDH was used as the reference control. *: p<0.01.

