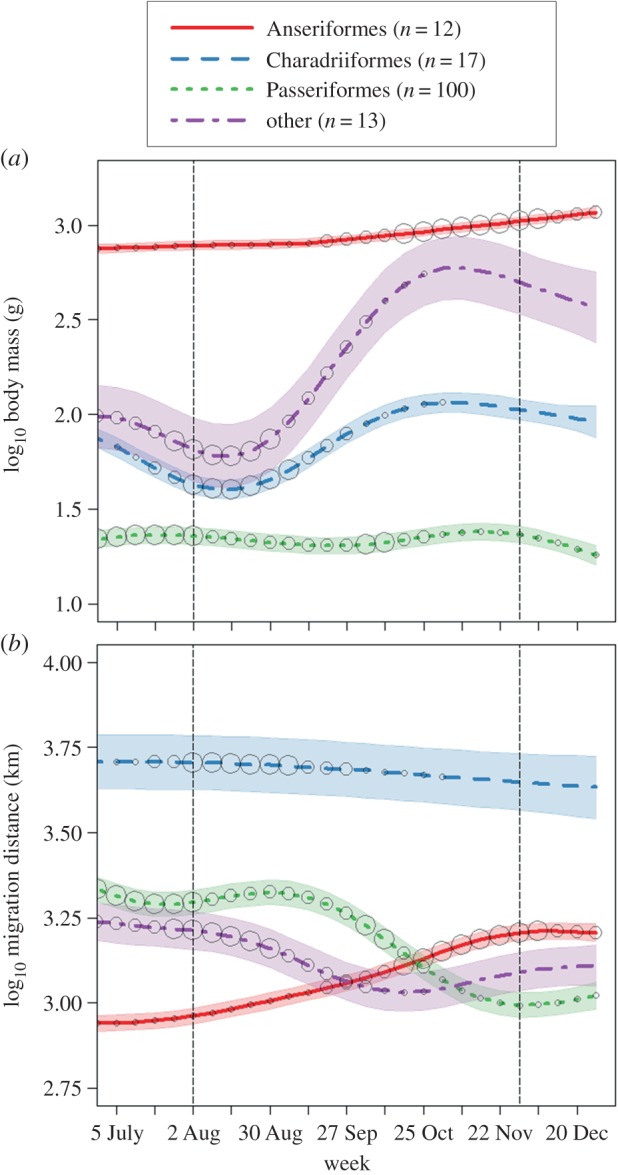
Figure 5.

Weekly assemblage-level estimates of (a) body size and (b) total migration distance at 12 weather surveillance radar (WSR) stations located in the northeastern USA (see the electronic supplementary material, figure S1) for 142 species of nocturnal migrating birds classified by order. The ‘other’ category contains 13 species in eight additional orders. The vertical dashed lines indicate the beginning and end of the radar data period. Regression lines and shaded areas show the fitted response and 95% confidence bands of generalized additive mixed models with WSR station as a random effect. The size of the circle displays the weekly average probability of occurrence for species at the WSR stations, scaled within each avian order from low (small circle) to high (large circle) probability of occurrence.
