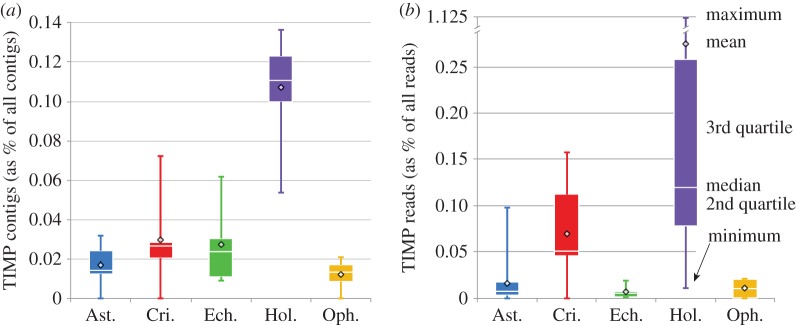
Figure 2.
Boxplots for the 405 TIMP genes identified in our transcriptome database, represented as a proportion of all contigs assembled from each taxon, and averaged across each of the five classes (a), as well as the average read depth per TIMP contig, as a proportion of all reads for each taxon, averaged for each class (b).

