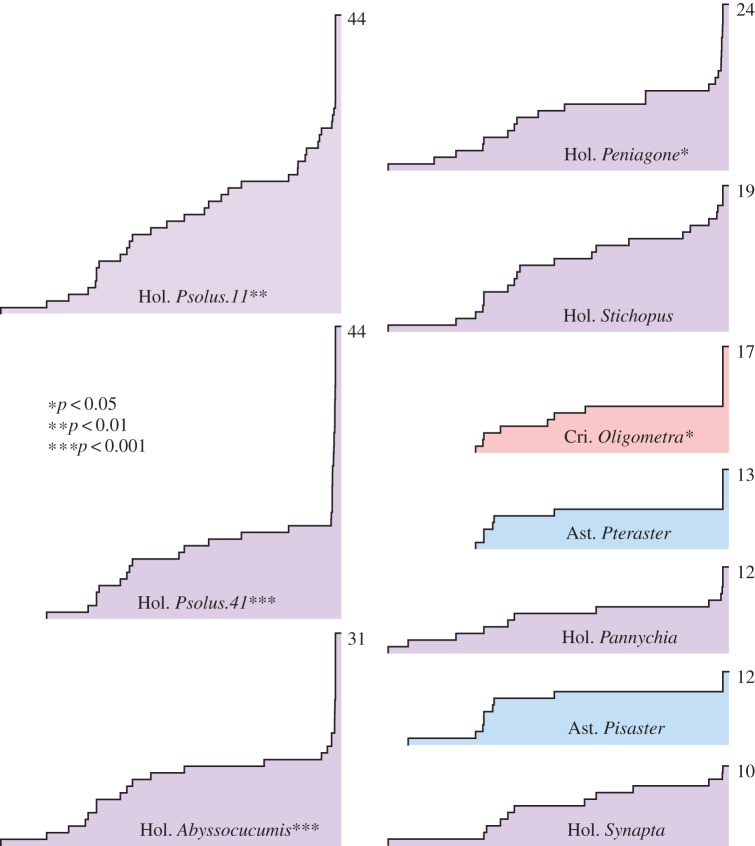
Figure 4.
Simplified lineages-through-time (LTT) plots for TIMP genes in specimens with more than 10 copies in an alignment of 392 echinoderm TIMP coding sequences. The x-axis of each plot is the time since the root, and the y-axis is the number of lineages; the final lineage count is shown to the right of the final height. p-Values for the gamma statistic are shown for each specimen, lower values indicating a greater deviation from a constant rate of diversification.

