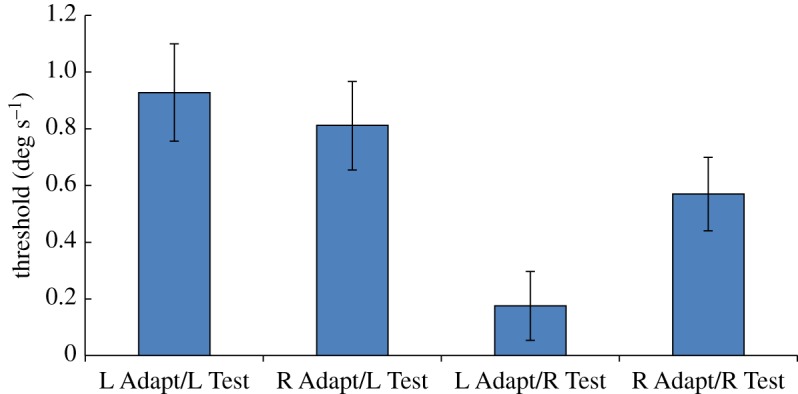
Figure 3.

Results of Experiment 3. Stimuli were identical to those in Experiment 2, but the task was the same as that in Experiment 1. Only one half of the test stimulus aperture, either upper or lower, contained coherently moving dots; the other half contained incoherently moving dots. In half of the test presentations, the coherent motion was leftward, and in the remainder it was rightward. Participants were instructed to report the direction of coherent motion in the test pattern, regardless of where in the display it appeared. The graph plots the mean displacement threshold for correctly reporting the direction of coherent motion, when the motion was leftward or rightward (‘L Test’ and ‘R Test’, respectively), following adaptation to static left-facing or right-facing implied motion images (‘L Adapt’ and ‘R Adapt’, respectively). Vertical bars indicate±1 s.e.m.
