Figure 2.

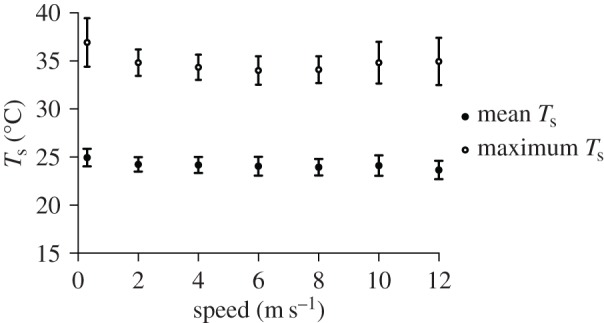
Average and maximum body Ts across flight speeds ranging from 0 to 12 m s−1. Values for 0 m s−1 are offset slightly for clarity. Average Ts declined slightly with flight speed while maximum Ts changed in a shallow U-shaped pattern.

Average and maximum body Ts across flight speeds ranging from 0 to 12 m s−1. Values for 0 m s−1 are offset slightly for clarity. Average Ts declined slightly with flight speed while maximum Ts changed in a shallow U-shaped pattern.