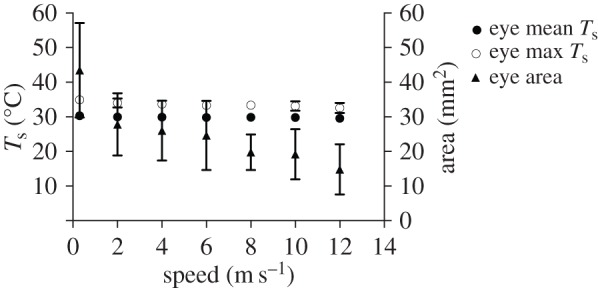
Figure 3.

Eye HDA average and maximum Ts, and area across flight speeds ranging from 0 to 12 m s−1. Average and maximum Ts decreased significantly between 0 and 2 m s−1, but remained constant above 2 m s−1. Area of the eye HDA decreased with flight speed.
