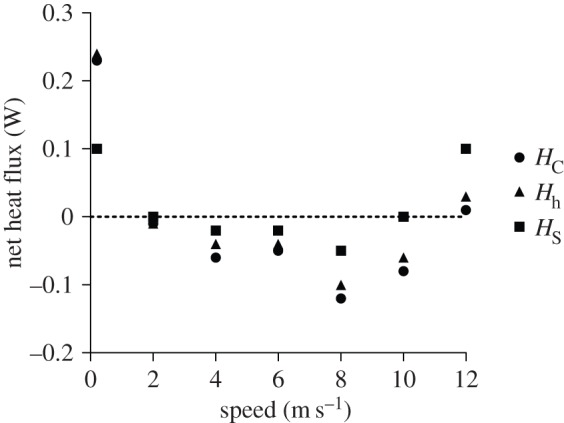
Figure 8.

Estimates of net heat flux for S. calliopeacross tested wind speeds assuming heat transfer occurs only across HDAs (approx. 8% of total surface area). Circles are values for HC (method 1), triangles are values for Hh (method 2) and squares are values for HS (method 3). The dotted line represents the condition of perfect heat balance.
