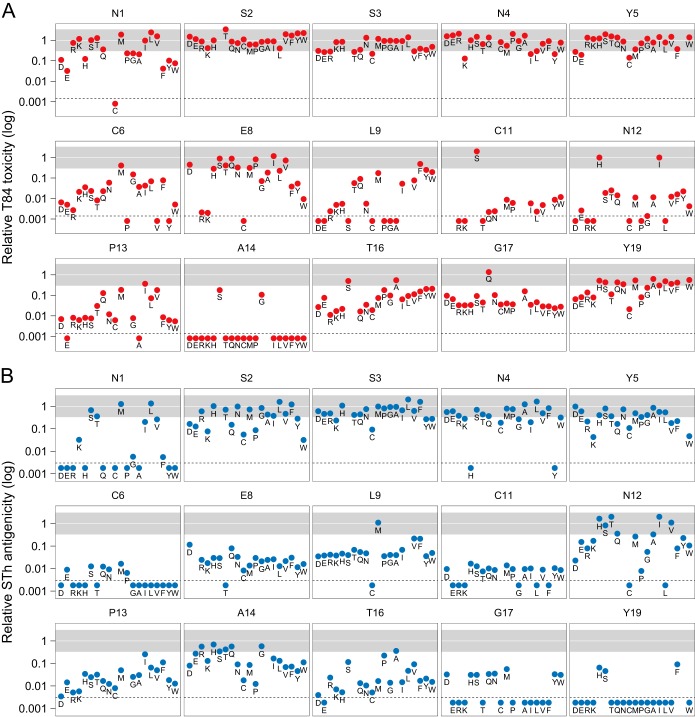
FIG 2.
Toxicity and αSTh antigenicity of culture filtrates harboring mutant forms of STh relative to those of native STh. (A, B) Toxicity was measured with the T84 assay (A), and αSTh antigenicity was measured with an anti-STh polyclonal antibody (αSTh) in a competitive ELISA (B). The relative toxicities and antigenicities are presented in 15 graphs, each representing an amino acid position of STh. The data points are marked with single-letter amino acid codes to highlight individual mutations. The region from 0.3- to 3.3-fold relative toxicity or antigenicity is shaded gray and represents changes that may be attributed to variations in expression levels, as observed in native STh controls. The amino acids are ordered by physicochemical properties (acidic, D and E; basic, R and K; polar, H, S, T, Q, and N; nonpolar, C, M, P, G, A, I, L, and V; aromatic, F, Y, and W). Mutant forms of STh that did not display detectable culture filtrate toxicity or antigenicity are plotted below the dotted lines, which represent the detection limits of the assays, which were 0.0014 for toxicity and 0.0034 for antigenicity. A total of 273 mutant forms of STh are represented in panels A and B. None of the mutant forms of STh in positions C7, C10, C15, and C18 had detectable toxicities or antigenicities, with the exception of C18Y, which had a relative antigenicity of 0.2. Graphs are not shown for these positions.

