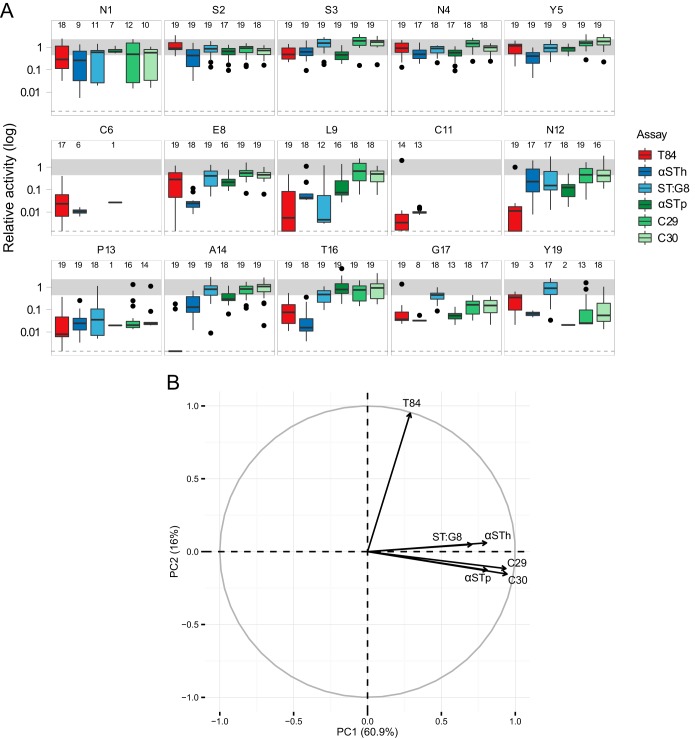
FIG 4.
Summary of T84 toxicity and antigenicities of culture filtrates harboring mutant forms of STh relative to those of native STh. (A) The graphs shown represent STh amino acid positions, and each one contains box plots of data from six different assays. The T84 assay data (T84) and the anti-STh polyclonal ELISA data (αSTh) are the same as in Fig. 2 and 3. In addition, the data are from an anti-STp polyclonal ELISA (αSTp), an anti-STh MAb ELISA (ST:G8), and two anti-STp MAb ELISAs (C29 and C30). Activity (toxicity or antigenicity) relative to that of native STh is shown on the vertical axis. The median relative activities of the mutant forms of STh are displayed as horizontal black lines; the bottom and top of the boxes represent the first and third quartiles, respectively; the upper whiskers represent the highest value that is within 1.5 times the interquartile range (IQR) of the third quartile; and the lower whisker represents the lowest value within 1.5 times the IQR of the first quartile. Outliers are shown as black points. The number of mutant forms that had detectable activity in each assay is reported for each amino acid position at the top of each graph. Values for mutant forms of STh with unmeasurable relative toxicity in the T84 assay but with detectable antigenicities were set to the assay detection limit (0.0014; dotted lines). Mutant forms of STh with changes at the cysteine positions were not analyzed in the MAb ELISAs. Graphs are not shown for positions C7, C10, C15, and C18 (see the legend to Fig. 2). (B) PCA correlation circle map of the six screen data sets. The first (PC1) and second (PC2) principal components are plotted (percent variance is in parentheses), showing a positive correlation between the ELISA data sets and a weak correlation between the ELISA data sets and the T84 assay data set. Prior to the PCA, missing values were set to the detection limit of the assays according to the rules described in Materials and Methods.

