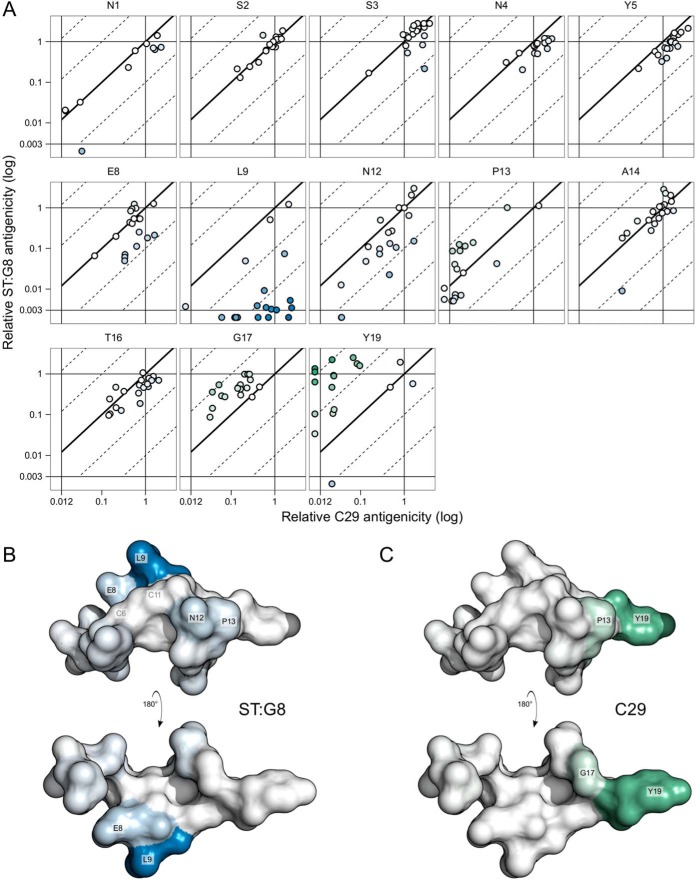
FIG 5.
Epitope mapping. (A) The graphs represent STh amino acid positions and show the relative C29 antigenicity values (horizontal axis) of each mutant form of STh plotted against the relative ST:G8 antigenicity values (vertical axis). C29 antigenicity and ST:G8 antigenicity were measured with the anti-STp MAb (C29) and the anti-STh MAb (ST:G8) ELISAs, respectively. Values for mutant forms of STh with unmeasurable antigenicity for one MAb were plotted outside the scale to the left (C29; <0.013) or bottom (ST:G8; <0.003). The diagonal lines represent the ST:G8 antigenicity/C29 antigenicity ratio (fold change) as follows: the full line represents no change, the dotted lines to the left represent 10- and 100-fold increases, and those to the right represent 10- and 100-fold reductions. A total of 229 mutant forms of STh are represented. Mutant forms of STh with changes at the cysteine residue positions were not screened. (B) Structural model of STh (22) with two views of the structure shown, rotated 180° along the x axis in relation to each other. Amino acids are colored according to the median ST:G8 antigenicity-C29 antigenicity changes of each amino acid position. For the C29 MAb, increases are in shades of green, and for the ST:G8 MAb, reductions are in shades of blue, reflecting their values.

