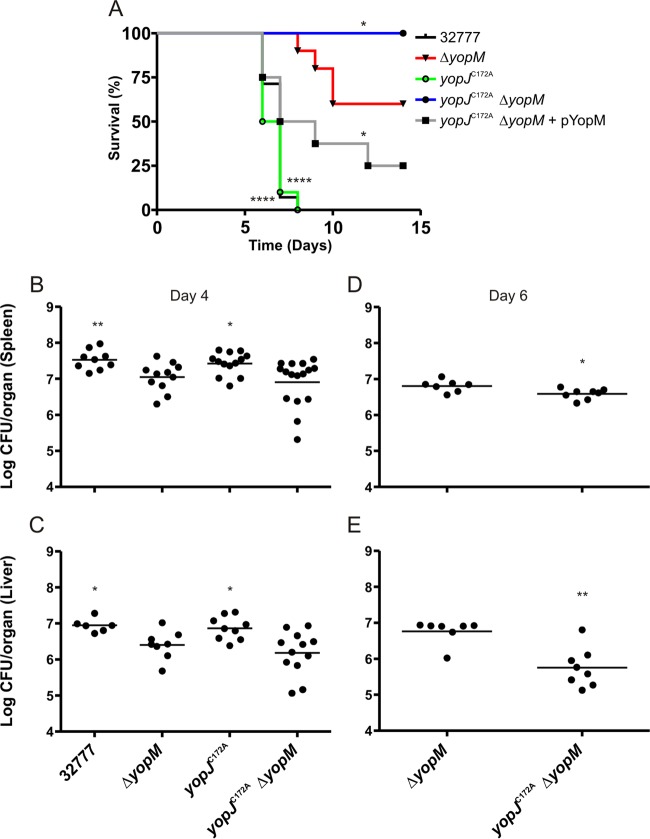
FIG 4.
Determination of survival and organ colonization of mice infected with Y. pseudotuberculosis. C57BL/6 mice were infected i.v. with ∼1,000 CFU of the indicated Y. pseudotuberculosis strain. (A) Time to death was monitored for 14 days [n = 14 for 32777 and the yopJC172AΔyopM strains; n = 10 for the ΔyopM and yopJC172A strains; and n = 8 for the yopJC172AΔyopM(pYopM) strain]. (B and C) At 4 days postinfection, mice were euthanized, and organs were collected and processed for CFU assay (n = 11 for 32777 and the ΔyopM strains; n = 14 for the yopJC172A strain; and n = 17 for yopJC172AΔyopM strain). Data from all spleens and the subset of livers analyzed are shown, with horizontal bars indicating arithmetic means. Data in panels A, B, and C represent values from four or five independent experiments. (D and E) At 6 days postinfection, mice were euthanized, and organs were collected and processed for CFU assay (n = 8 for the ΔyopM strain, and n = 8 for the yopJC172AΔyopM strain). Data in panels D and E represent values from two independent experiments. Significance of differences between survival curves in panel A was determined by log rank test, while the significance of differences in organ colonization in panels B and C was calculated using a Mann-Whitney test, in all cases compared to values for ΔyopM mutant-infected mice. *, P < 0.05; **, P < 0.01; ****, P < 0.0001. All CFU values were analyzed by Grubb's test to identify significant outliers, and all data from any mouse found to have an outlying value are not shown and were removed prior to the calculation of significance.

