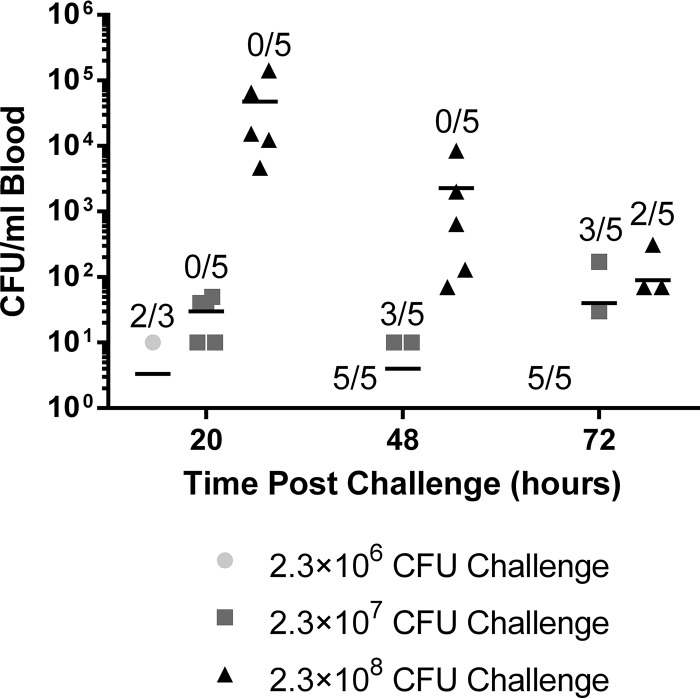
FIG 6.
Reduction in the S. epidermidis challenge dose accelerated the clearance of bacteria from the bloodstream of TLR2−/− mice. Groups of 3 to 5 TLR2−/− mice were challenged i.v. with 2.34 × 10⁶, 2.34 × 10⁷, or 2.34 × 10⁸ CFU. The bacterial burden was assessed in blood at the indicated time points. Data points indicate the levels of CFU per milliliter for individual animals. Each line indicates the mean for each group. Because the y axis is logarithmic, only values greater than zero are plotted. The value was zero for 20 mice; therefore, the data for those mice are not visible on the graph. In the displayed fractions, the numerator indicates the number of mice in that group in which 0 CFU of S. epidermidis/ml was detected in the blood at the specified time point whereas the denominator indicates the total number of mice in that group.

