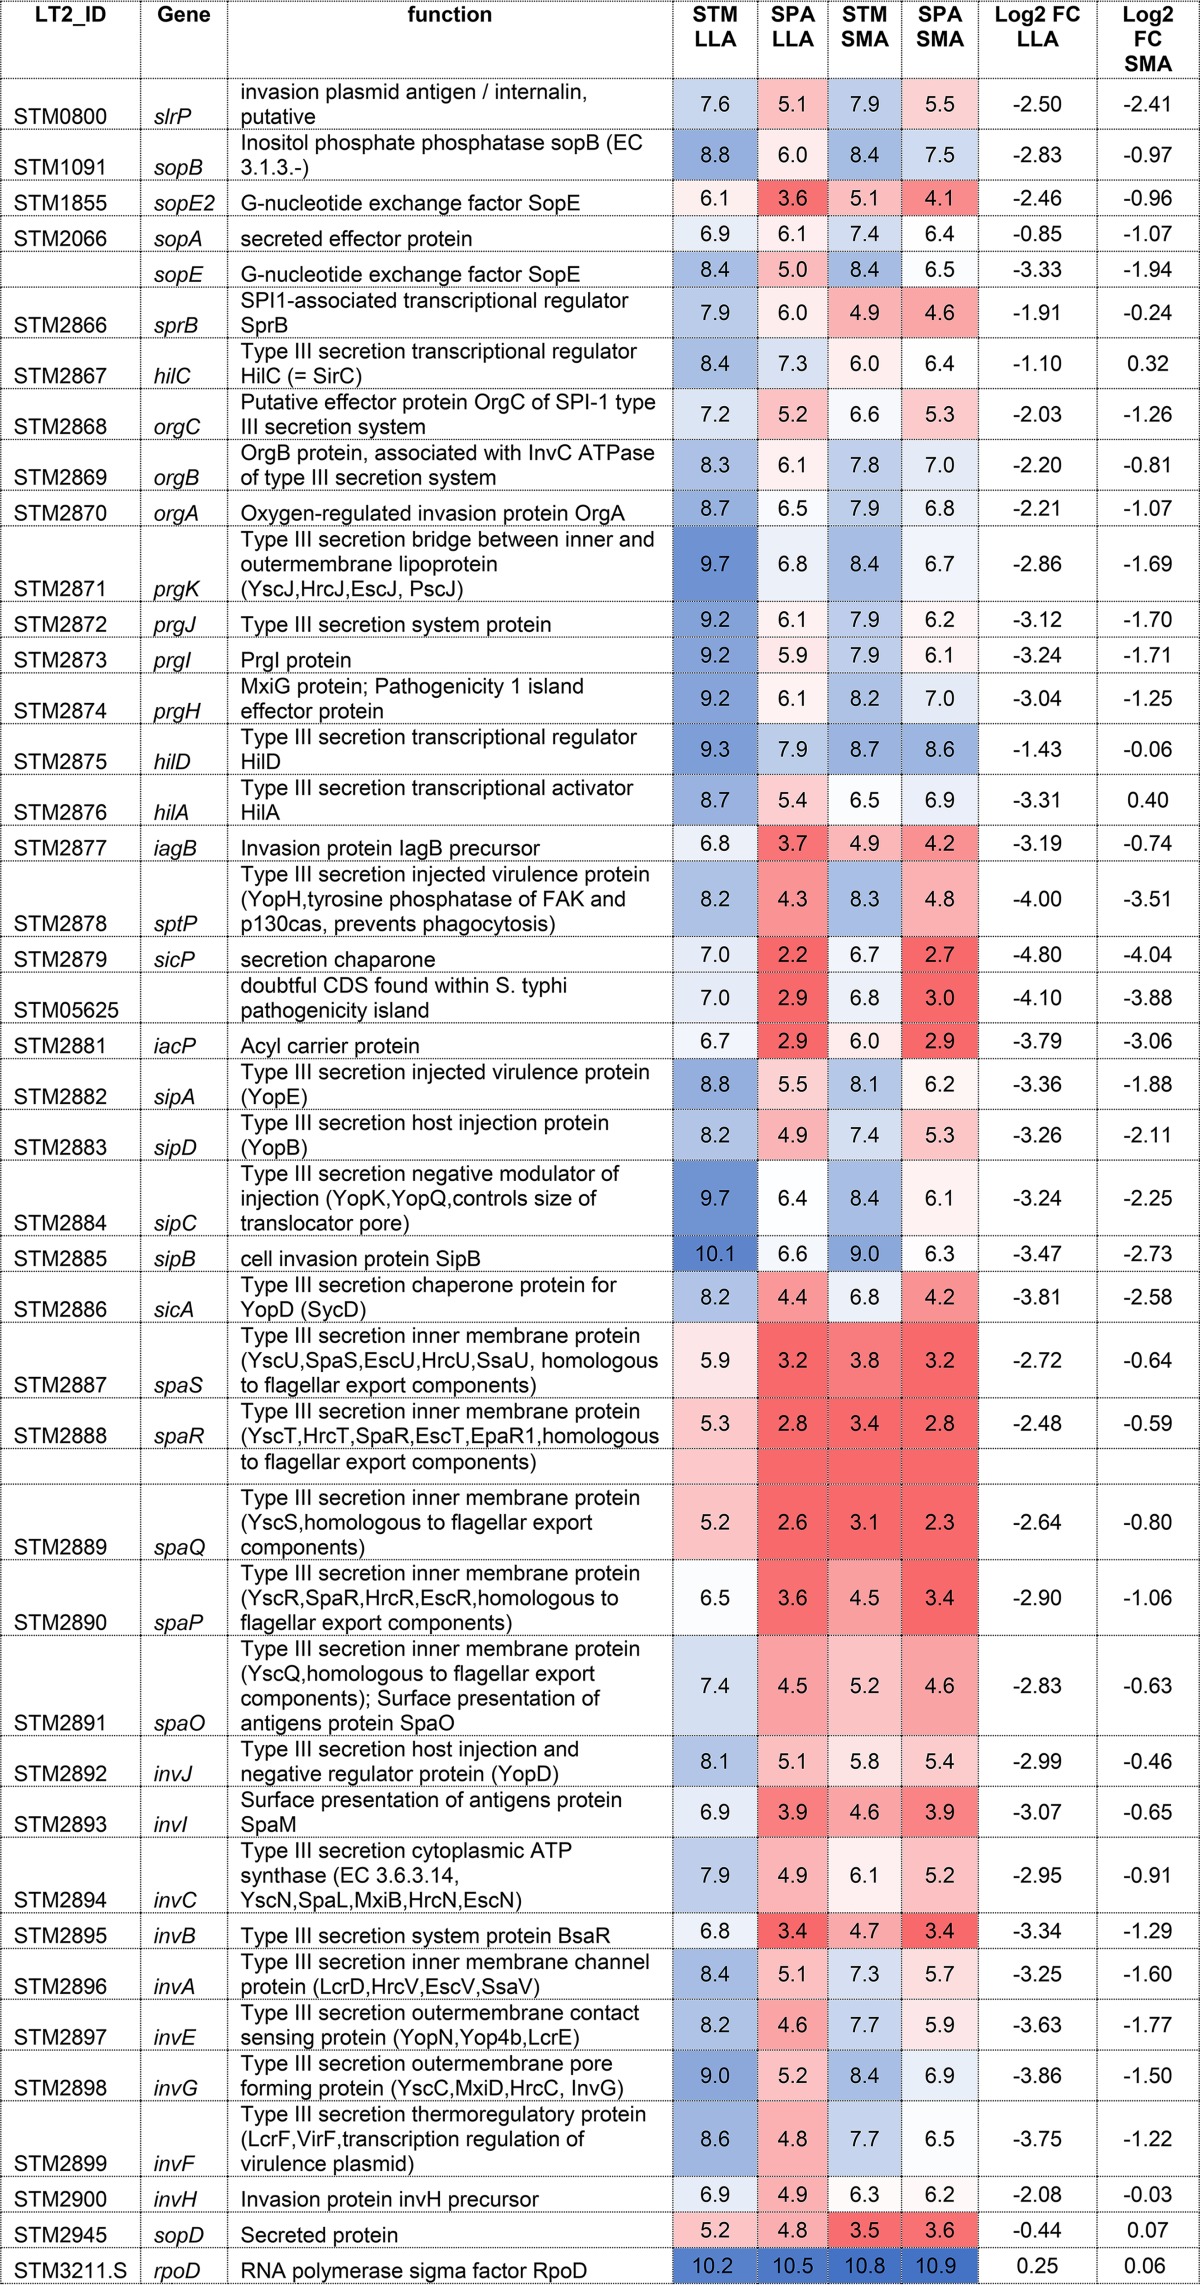
TABLE 1.
Transcription of the SPI-1 regulon in S. Paratyphi A and S. Typhimuriuma
Gene tags in S. Typhimurium LT2 are shown in the first column. STM and SPA columns represent averaged FPKM (fragments per kilobase per million reads) values on a log2 scale for SPI-1 genes and rpoD as a reference control assayed from two independent biological replicates. RNA was extracted from S. Typhimurium SL1344 (STM) and S. Paratyphi A 45157 (SPA) cultures grown to late logarithmic phase at 37°C under aerobic conditions (LLA) and from cultures grown to the stationary phase under microaerobic conditions (SMA) as explained in Materials and Methods. Log2 FC represents the log2 fold change of the gene expression in SPA compared to that in STM. Transcription data are color-coded such that higher levels of transcription are colored in shades of blue and lower transcription is shaded in red.

