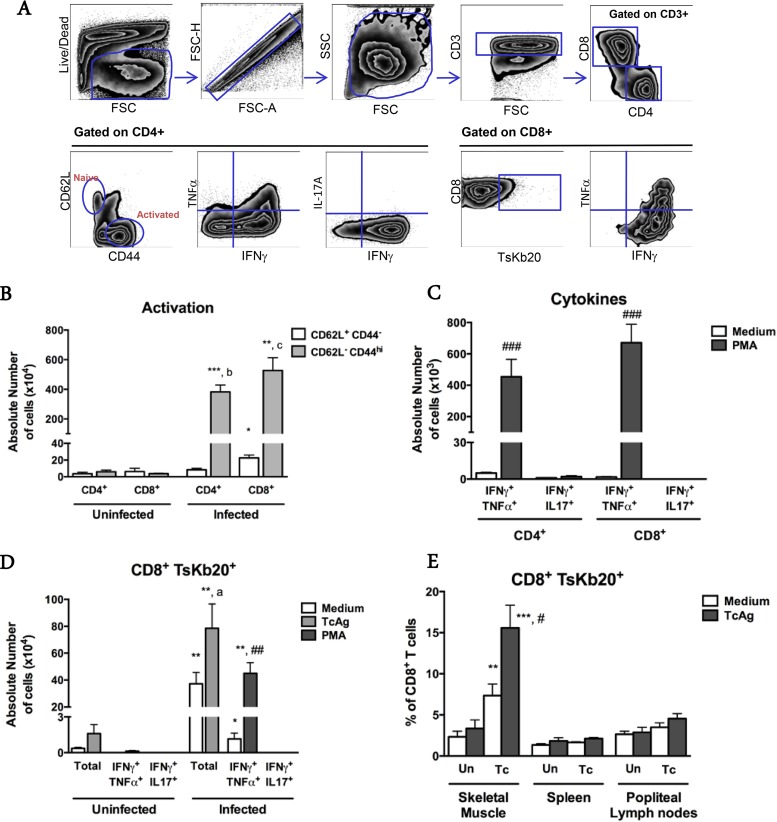
FIG 5.
Local T. cruzi-specific type I-skewed immune responses in skeletal muscles from chronically T. cruzi-infected mice. (A) Gating strategy. (B to E) Quantitative data for the indicated T cell functional states, analyzed after extraction of leukocytes from the indicated tissue or organ. (B) Lymphocytes were analyzed ex vivo. (C) T cells were restimulated in vitro with PMA-ionomycin or medium for 6 h. (D and E) T cells were restimulated in vitro with PMA-ionomycin for 6 h or with T. cruzi antigen (TcAg) or medium for 18 h. In panel E, “Un” denotes uninfected mice, and “Tc” denotes T. cruzi-infected mice. Data are from a representative experiment of a total of 2 independent experiments (n = 7 infected and 4 uninfected mice). *, **, and ***, P < 0.05, P < 0.01, and P < 0.005, respectively, for comparing corresponding uninfected and infected subpopulations; a, P < 0.05 for comparing medium and TcAg-stimulated conditions; b, P < 0.01 for comparing CD4+ subpopulations in infected mice; c, P < 0.005 for comparing CD8+ subpopulations in infected mice; #, ##, and ###, P < 0.05, P < 0.01, and P < 0.005, respectively, for comparing medium- and PMA-stimulated subpopulations. Statistical analysis was performed by the Mann-Whitney test.

