FIG 2.
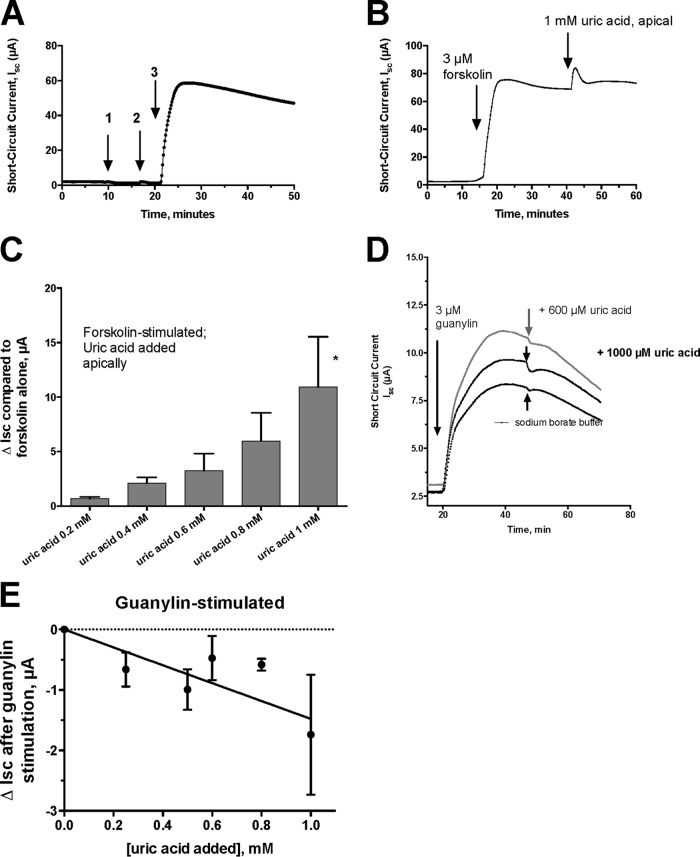
Effect of uric acid on chloride secretion in T84 cells in an Ussing chamber. All the tracings represent short-circuit current (Isc) tracings expressed in microamperes. (A) Lack of effect of adding 1 mM uric acid on the apical side (arrow 1) or on the basolateral side (arrow 2) of the monolayer. Arrow 3 shows that the tissue is still competent in secretion and responsive to 3 μM forskolin. (B) Additive effect of uric acid on secretion induced by forskolin. Forskolin (3 μM) was added first, and then uric acid was added apically, as indicated by the arrows. (C) Dose response of apical uric acid on ΔIsc, defined as the increase in Isc after adding uric acid. Each bar represents the mean and SD of 3 tracings. *, significantly greater than result with forskolin alone. (D) Effect of apical uric acid on Isc triggered by 3 μM guanylin, a cyclic GMP agonist. The top curve shows the response to 600 μM uric acid; the middle curve shows a small inhibitory effect of 1 mM uric acid, and the bottom curve shows the lack of effect of the sodium borate buffer. (E) Dose-dependent inhibition of guanylin-induced Isc by uric acid. Each point represents the mean ± SD of 3 tracings.

