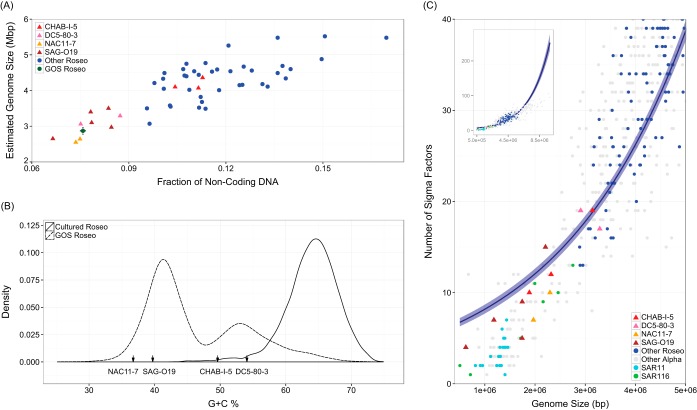
FIG 2.
Genomic characteristics of the four largely uncultivated Roseobacter lineages (CHAB-I-5, SAG-O19, DC5-80-3, and NAC11-7), cultured roseobacters, and GOS metagenomic Roseobacter reads. (A) Scatter plot of the percentage of noncoding DNA and the estimated genome size. (B) Frequency distribution of the G+C content of GOS Roseobacter reads and cultured roseobacters. G+C contents of the four major lineages are indicated by arrows along the x axis. (C) Number of sigma factors plotted against the length of assembled genomes for the four major lineages, as well as another 116 roseobacters, 20 SAR11, 7 SAR116, and 500 other Alphaproteobacteria genomes. The embedded panel displays the overall trend of the regression line, whereas the main graph provides a closeup view of the genome size between 0 to 5 Mbp in length. Data points from the four major lineages are symbolized with triangles and others with round dots. The data were fitted to a negative binomial generalized linear model with a log link, and the lighter blue shades confine the 95% confidence intervals. All four panels are colored with the same strategy: red for CHAB-I-5, pink for DC5-80-3, yellow for NAC11-7, brown for SAG-O19, green for GOS Roseobacter reads, blue for other roseobacters, cyan for SAR11, lime for SAR116, and gray for other members of the Alphaproteobacteria.

