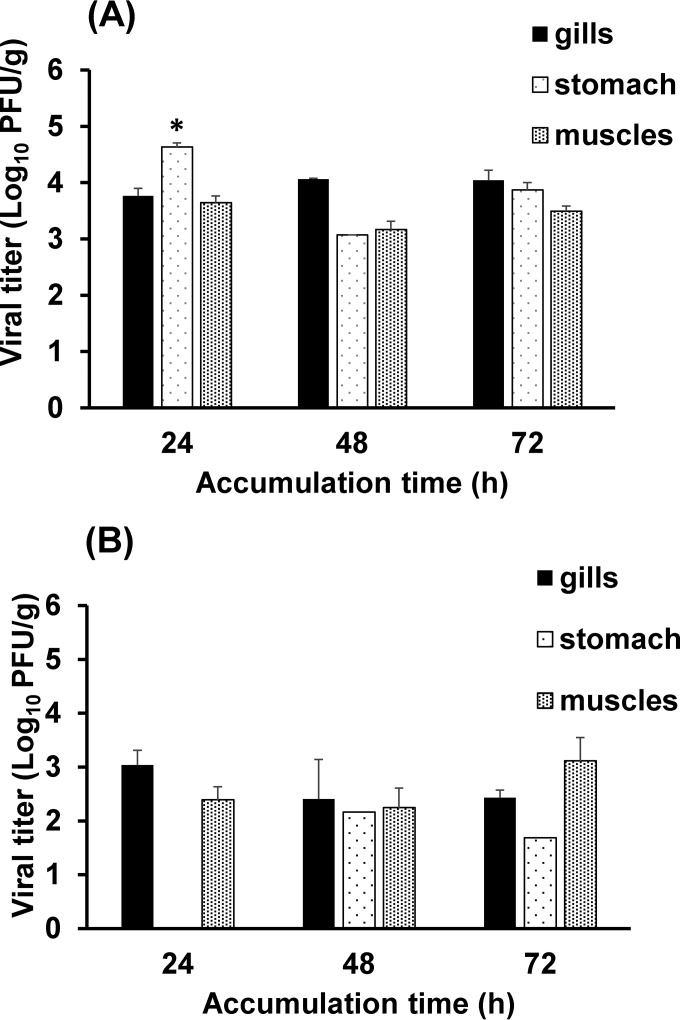
FIG 2.
Bioaccumulation of HAV and RV in oyster tissues. Shown is the bioaccumulation of HAV (A) and RV (B) in oyster gills, stomach, and muscles after 24, 48, and 72 h, as determined by plaque assays. Each bar represents the mean for three replicates ± 1 standard deviation. The asterisk indicates a statistically significant difference (P < 0.05).

